


EasyMap Charts
Create custom administrative data maps in minutes
什麼是 EasyMap Charts?
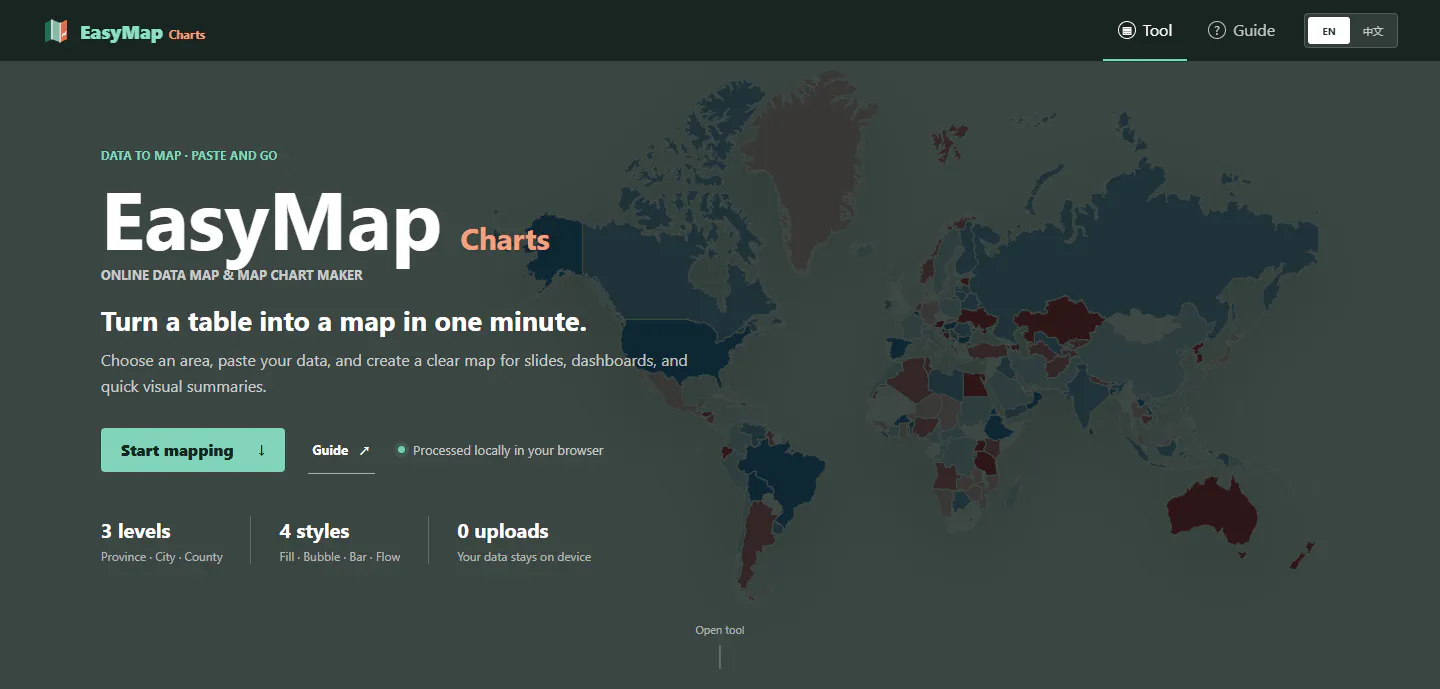
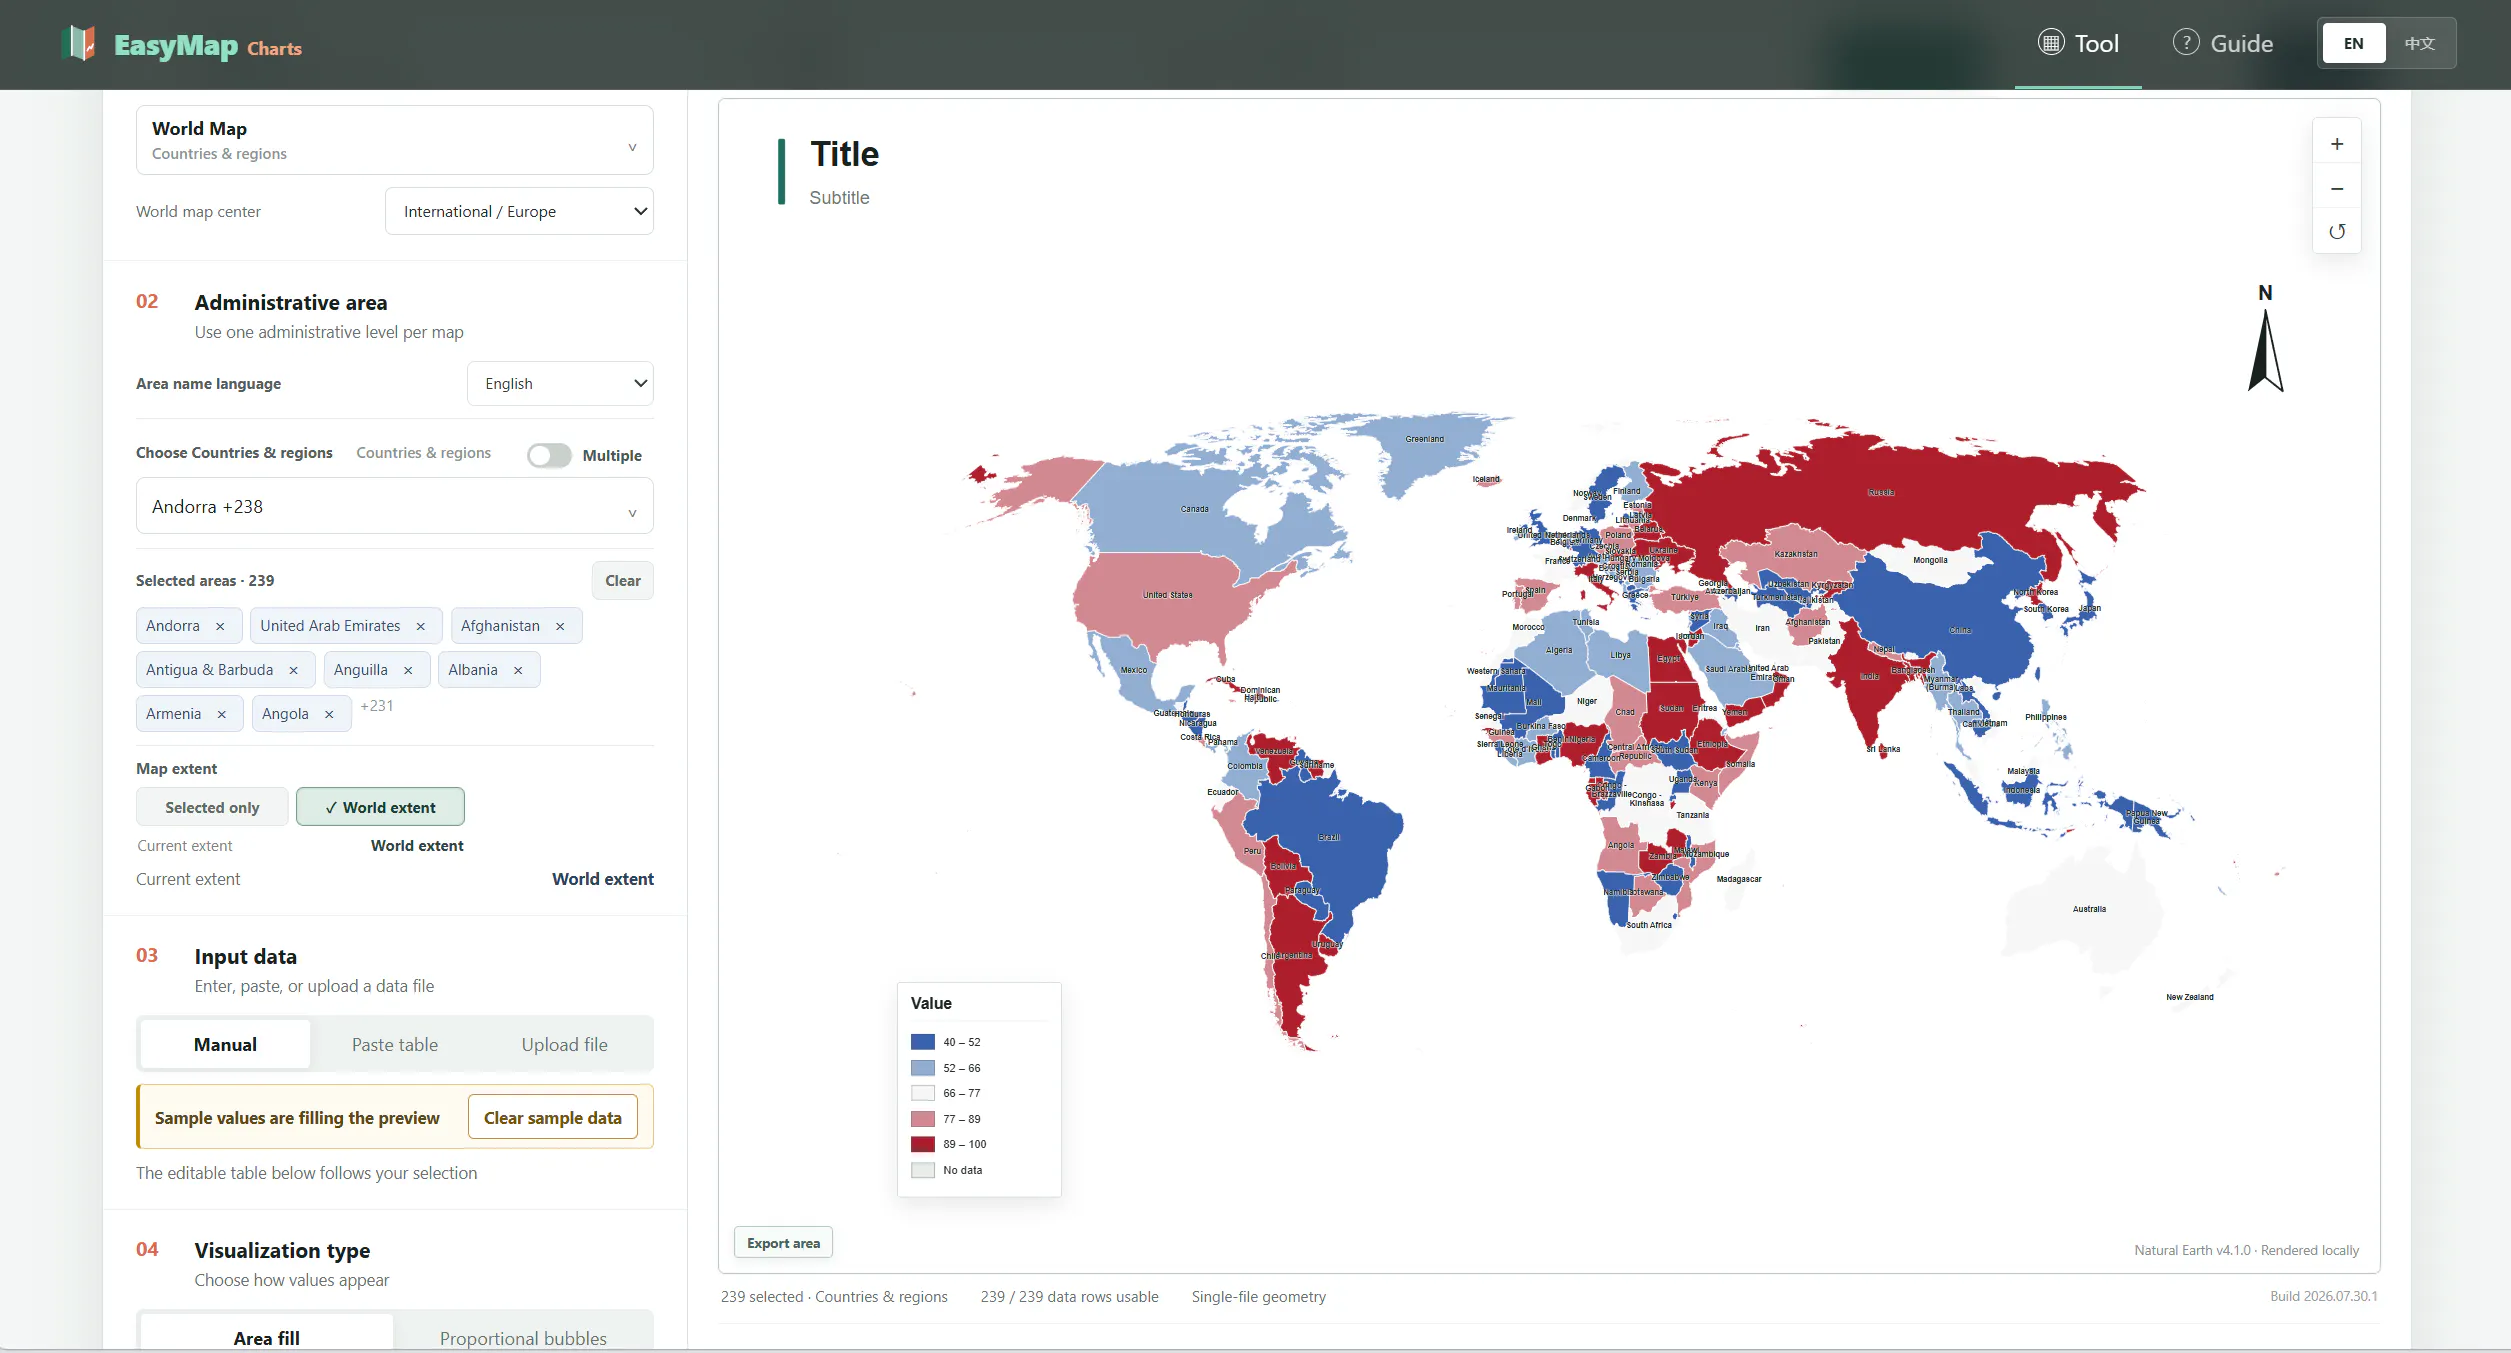
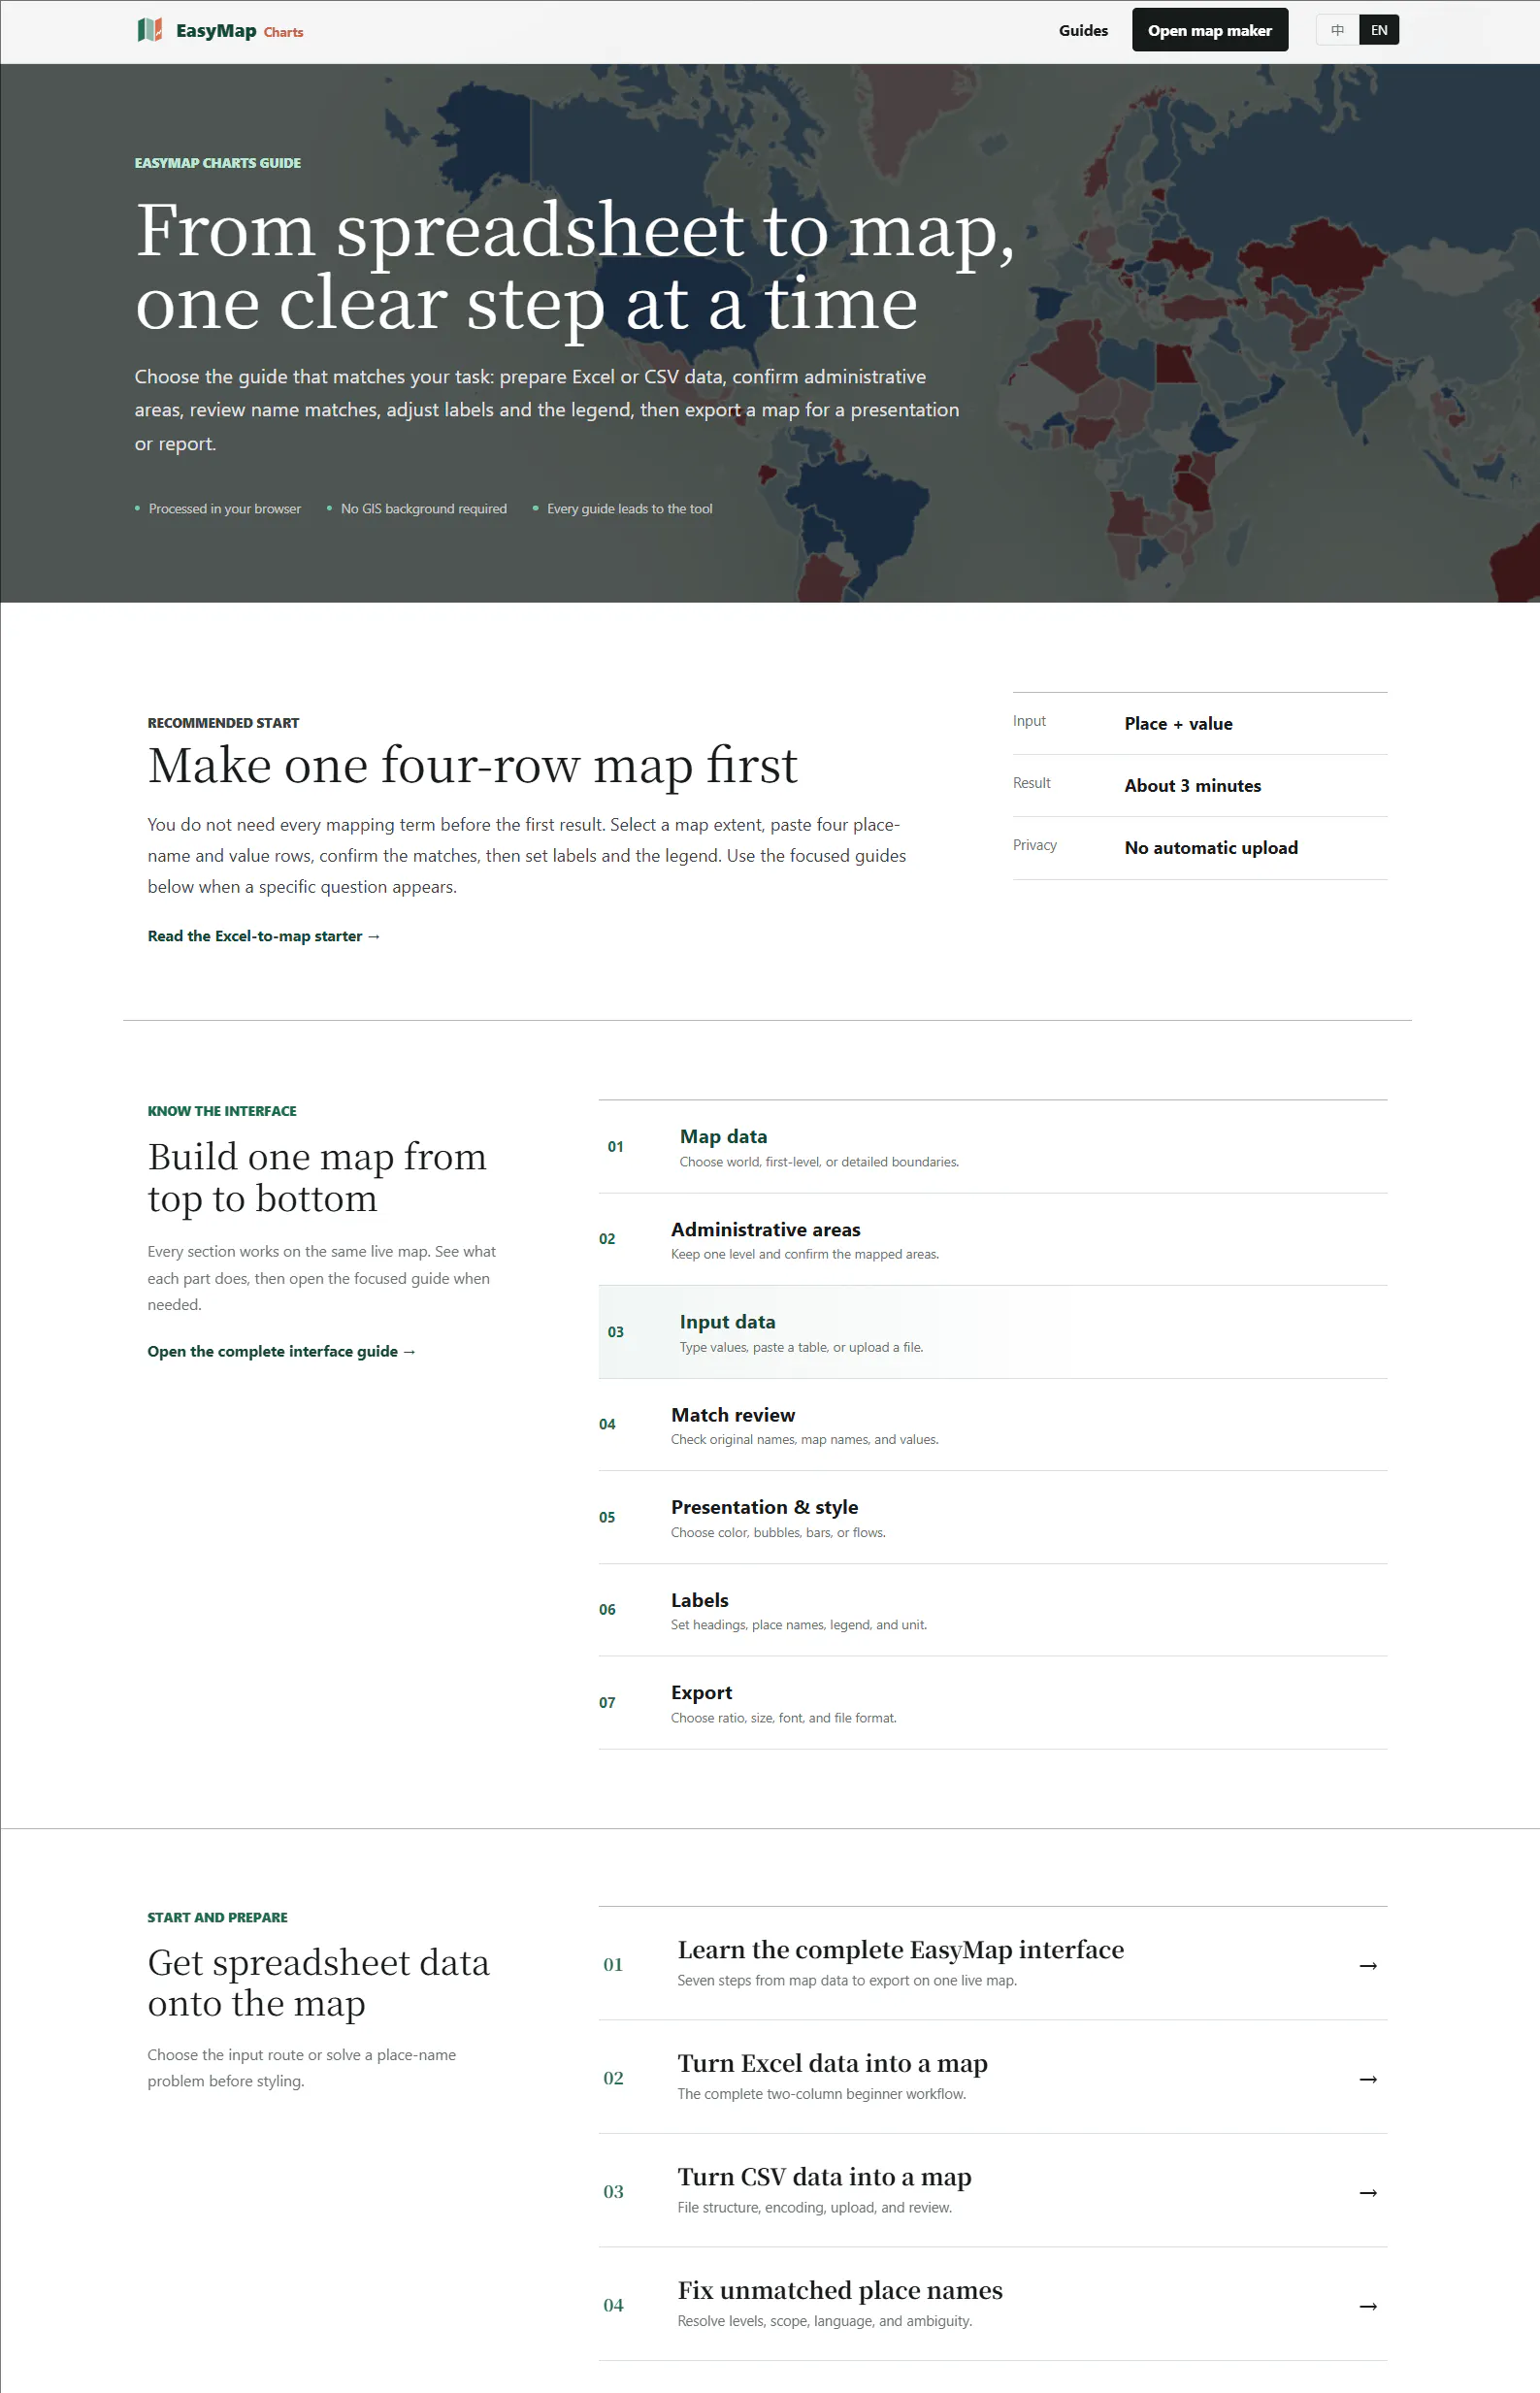
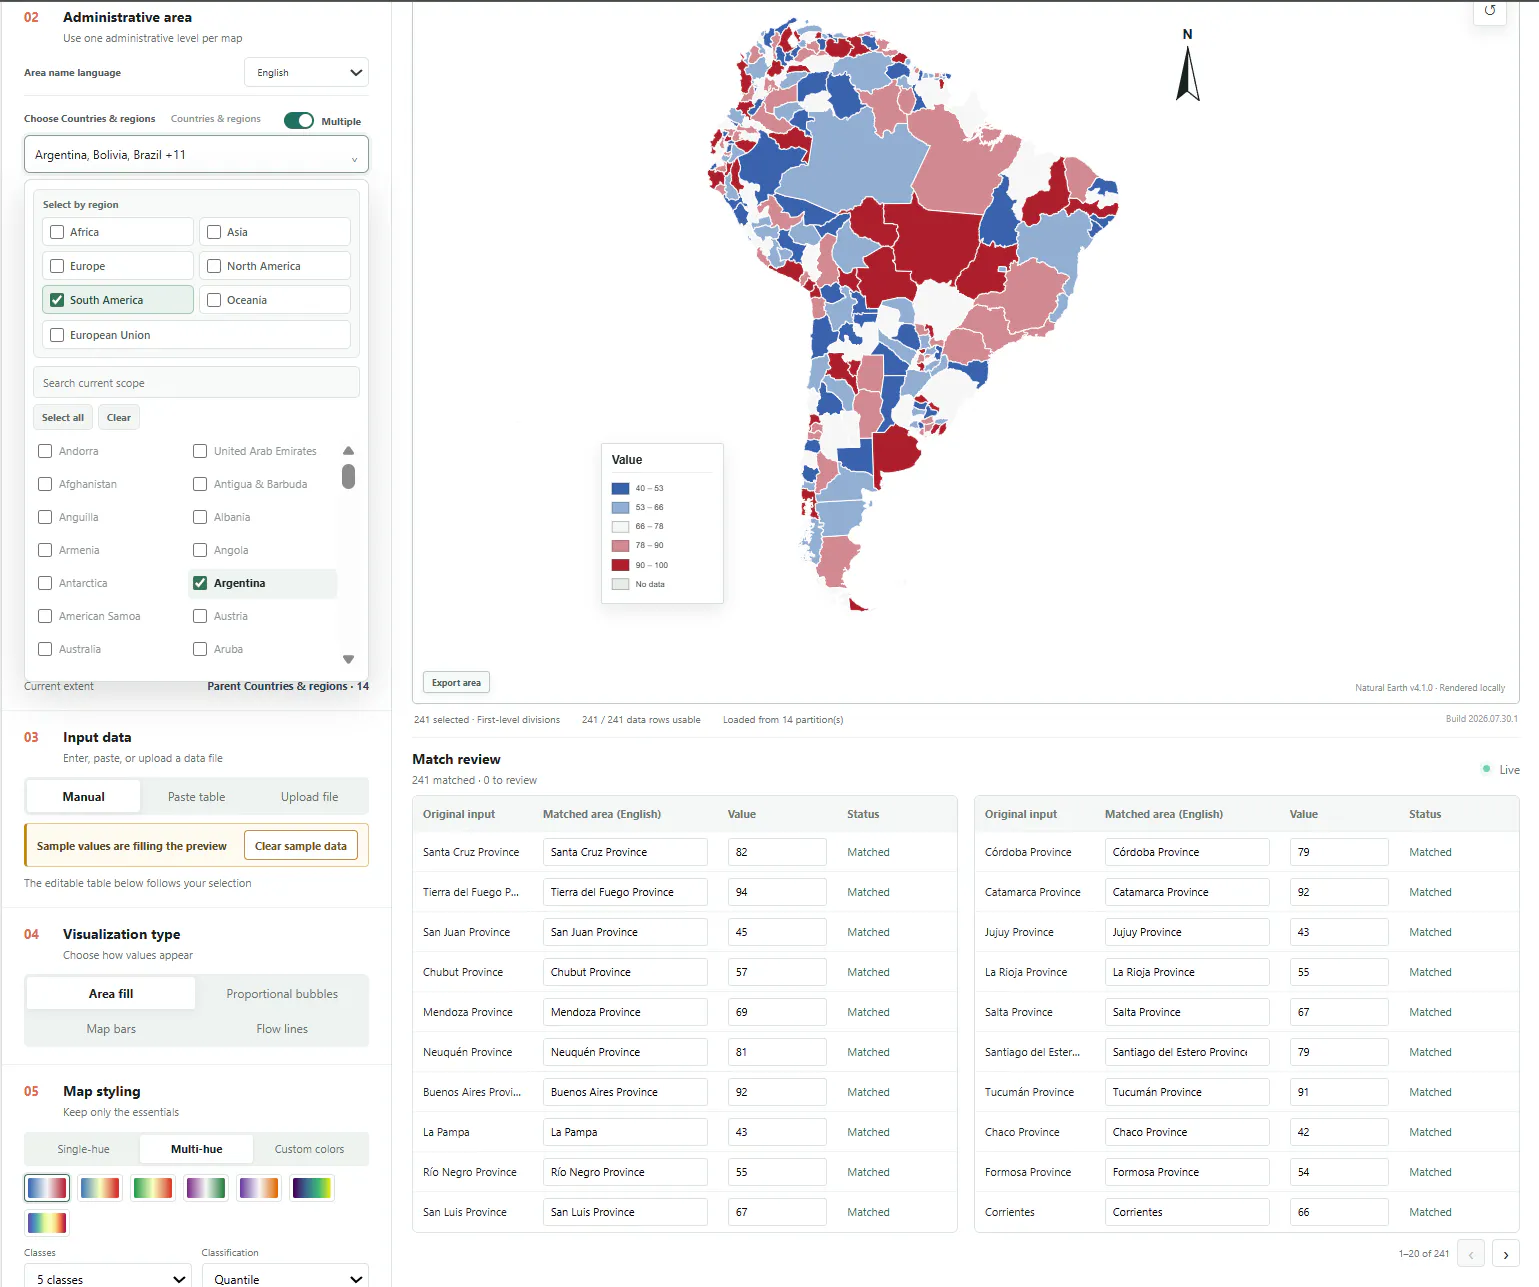
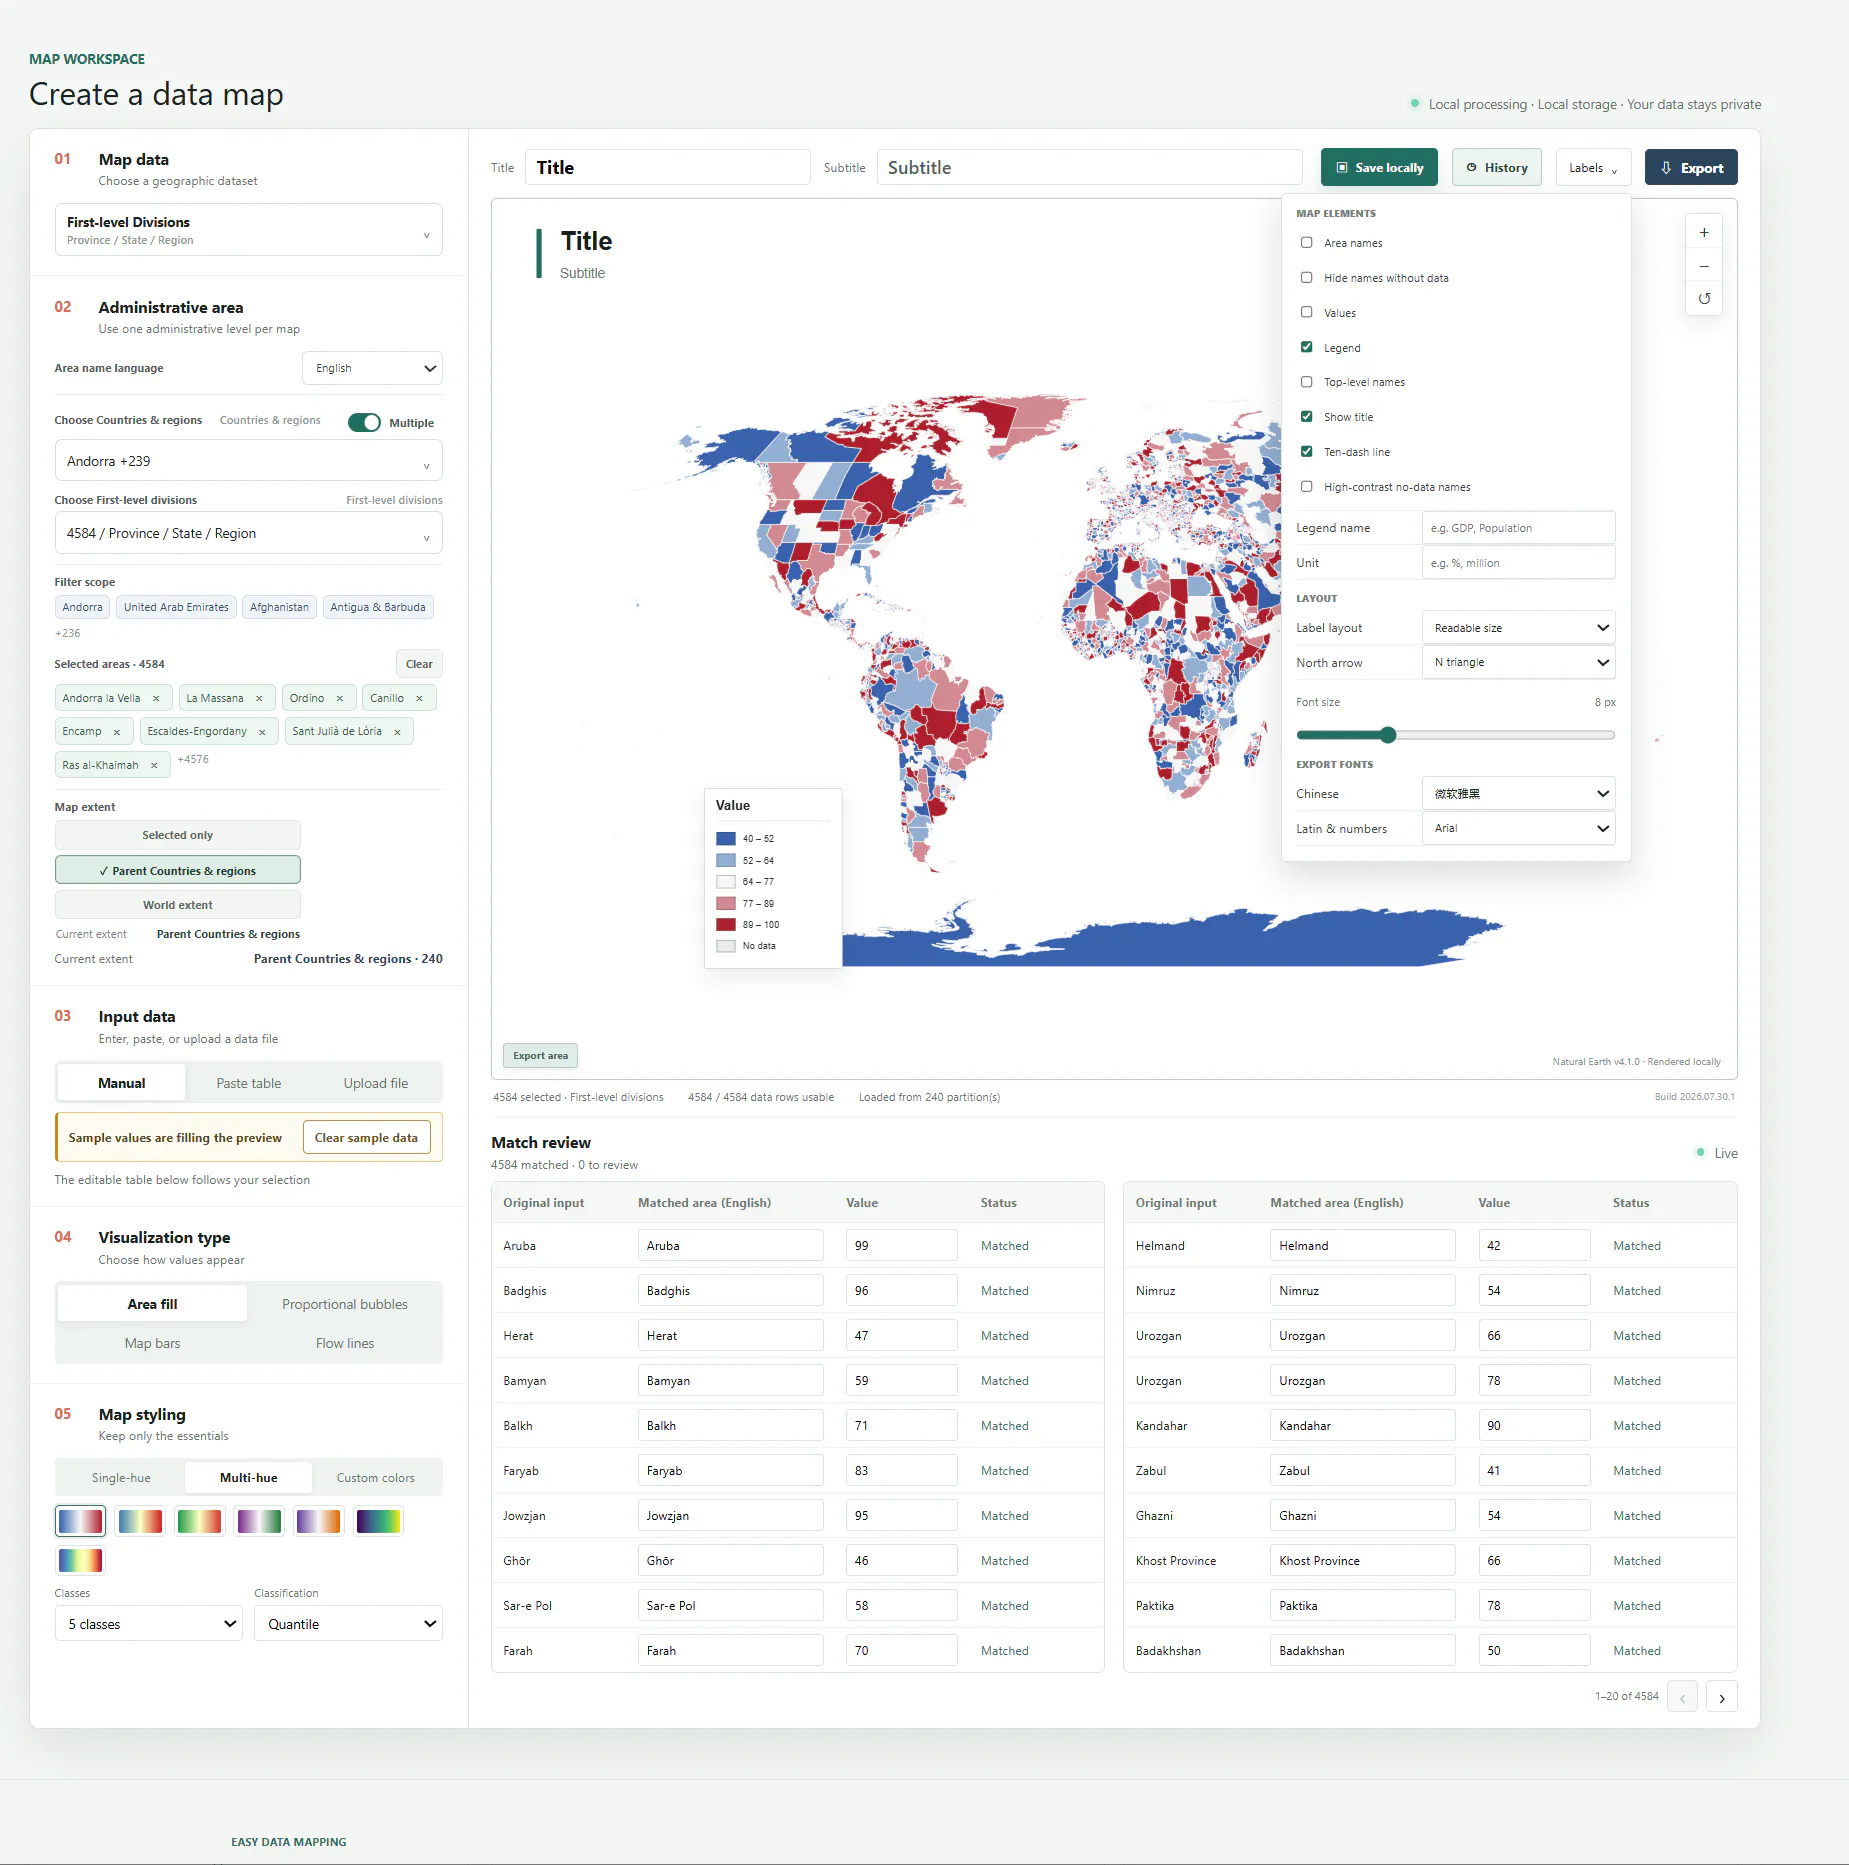
EasyMap Charts turns spreadsheet data into polished administrative maps in seconds. Enter values manually, paste a table, or upload CSV, TXT, XLSX, or XLS files. Create choropleth and origin-to-destination flow maps using worldwide country and first-level administrative boundaries, plus detailed maps for China. Customize colors, classes, labels, legends, projections, and exports. No account or GIS experience required, and your data stays in your browser.
截圖
?
還沒有評論,來搶沙發吧!
X 上關於 EasyMap Charts 的真實討論
去 X 發文