

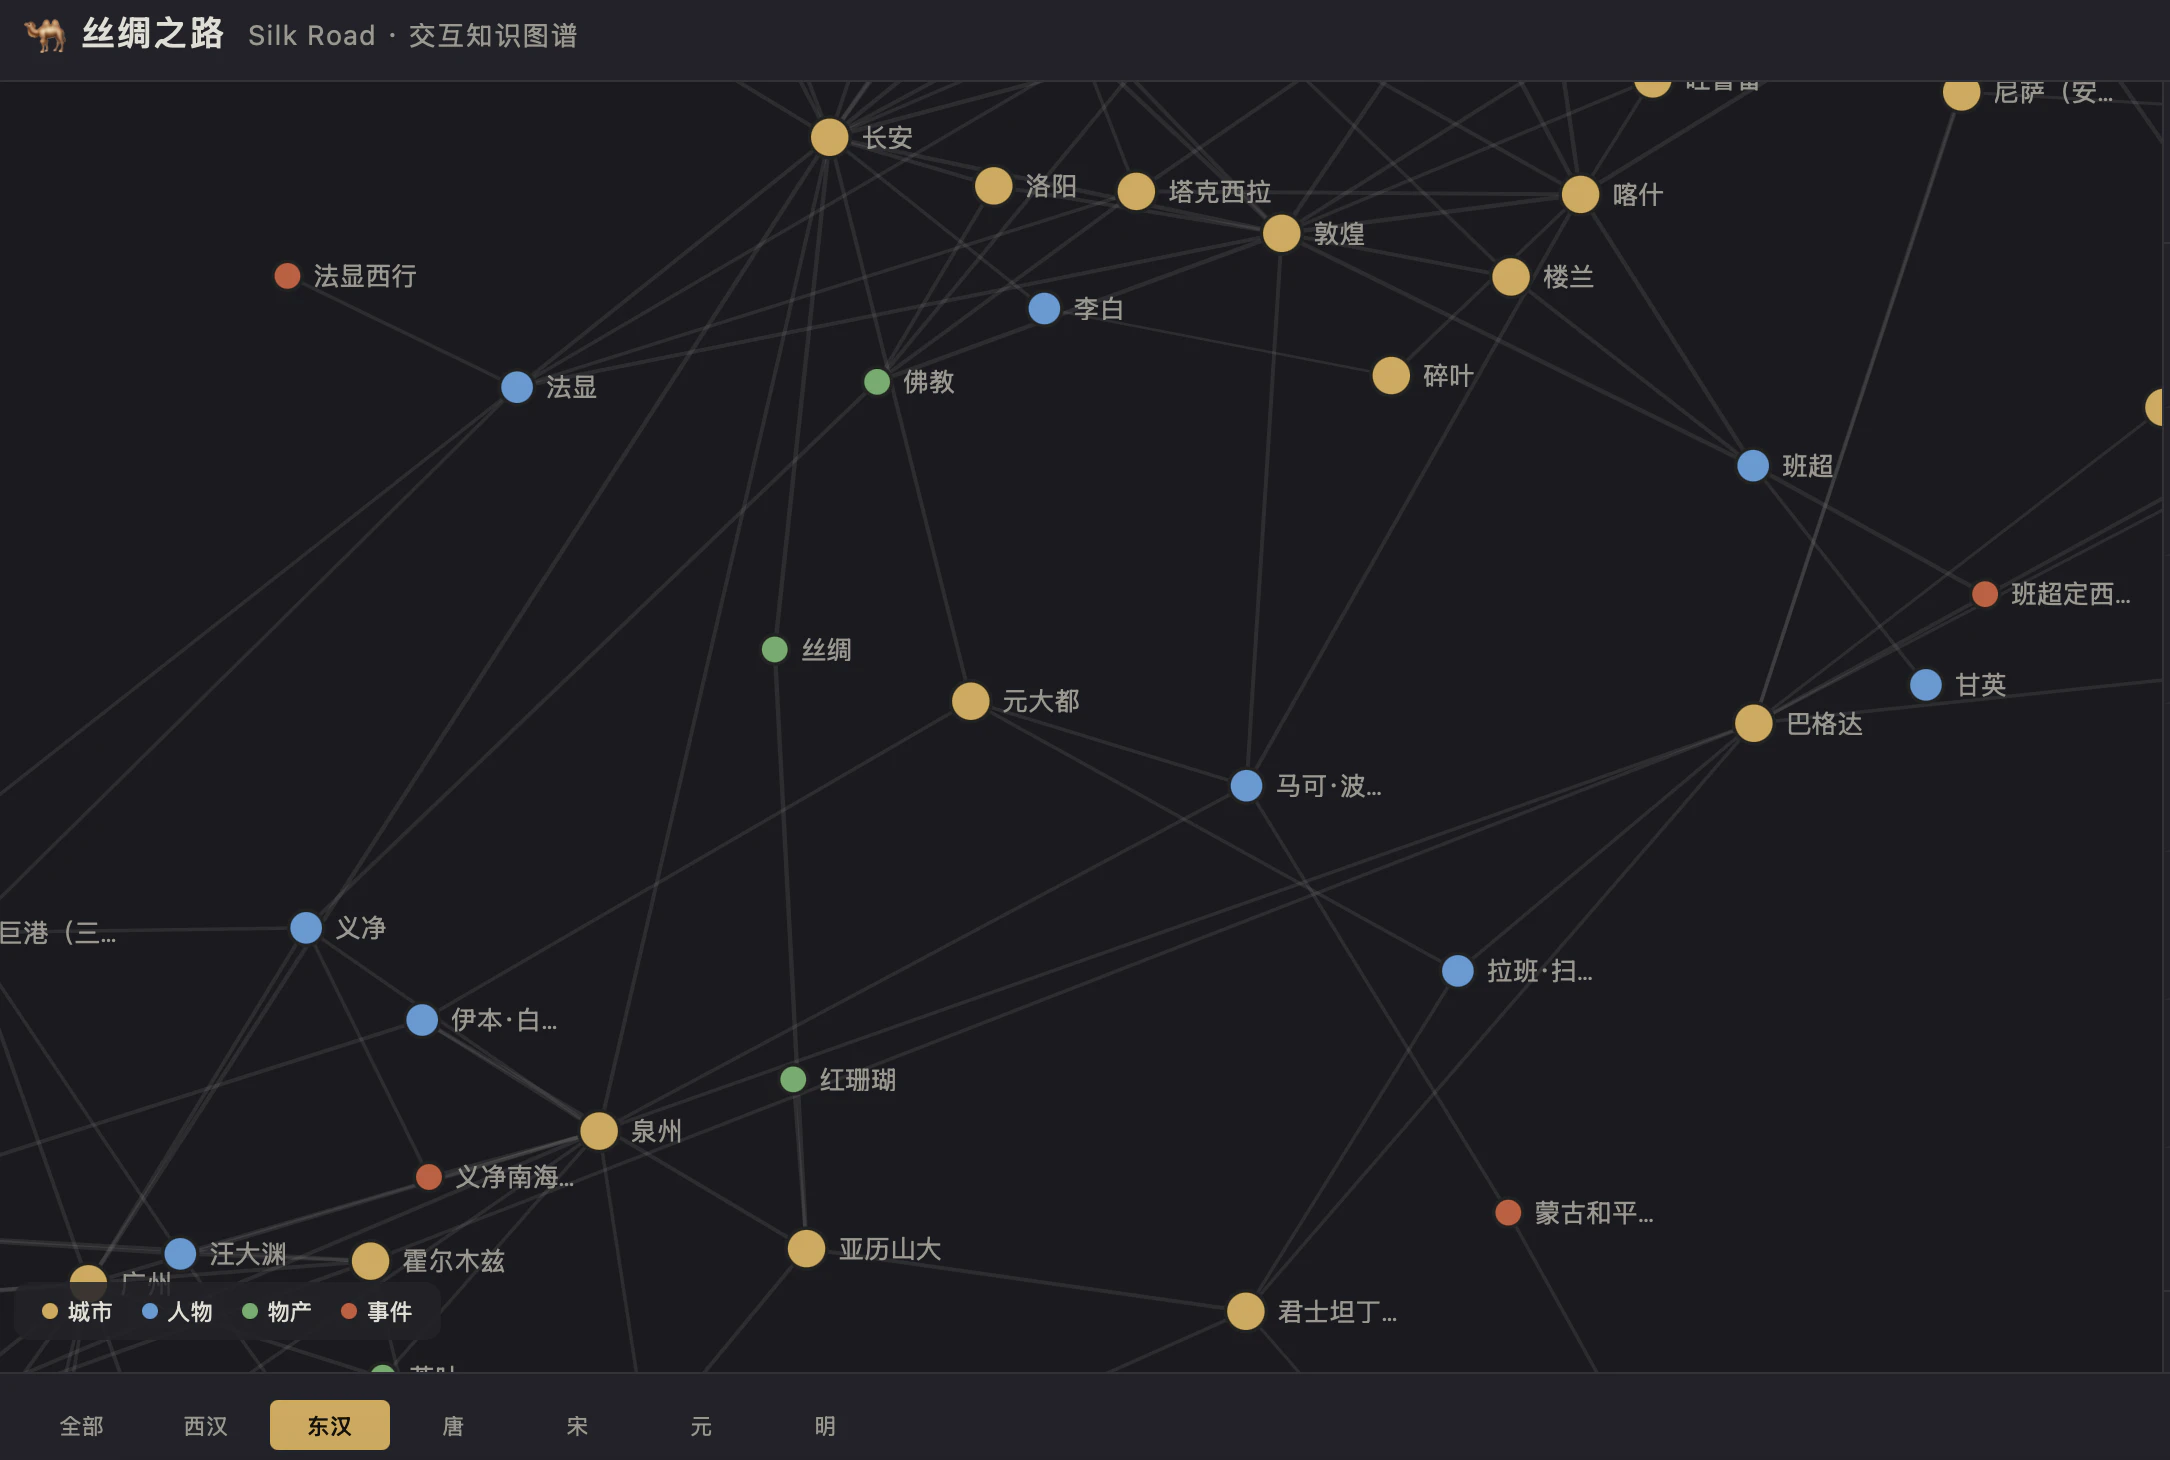
丝绸之路 · 交互知识图谱
Interactive knowledge graph of the ancient Silk Road
什麼是 丝绸之路 · 交互知识图谱?
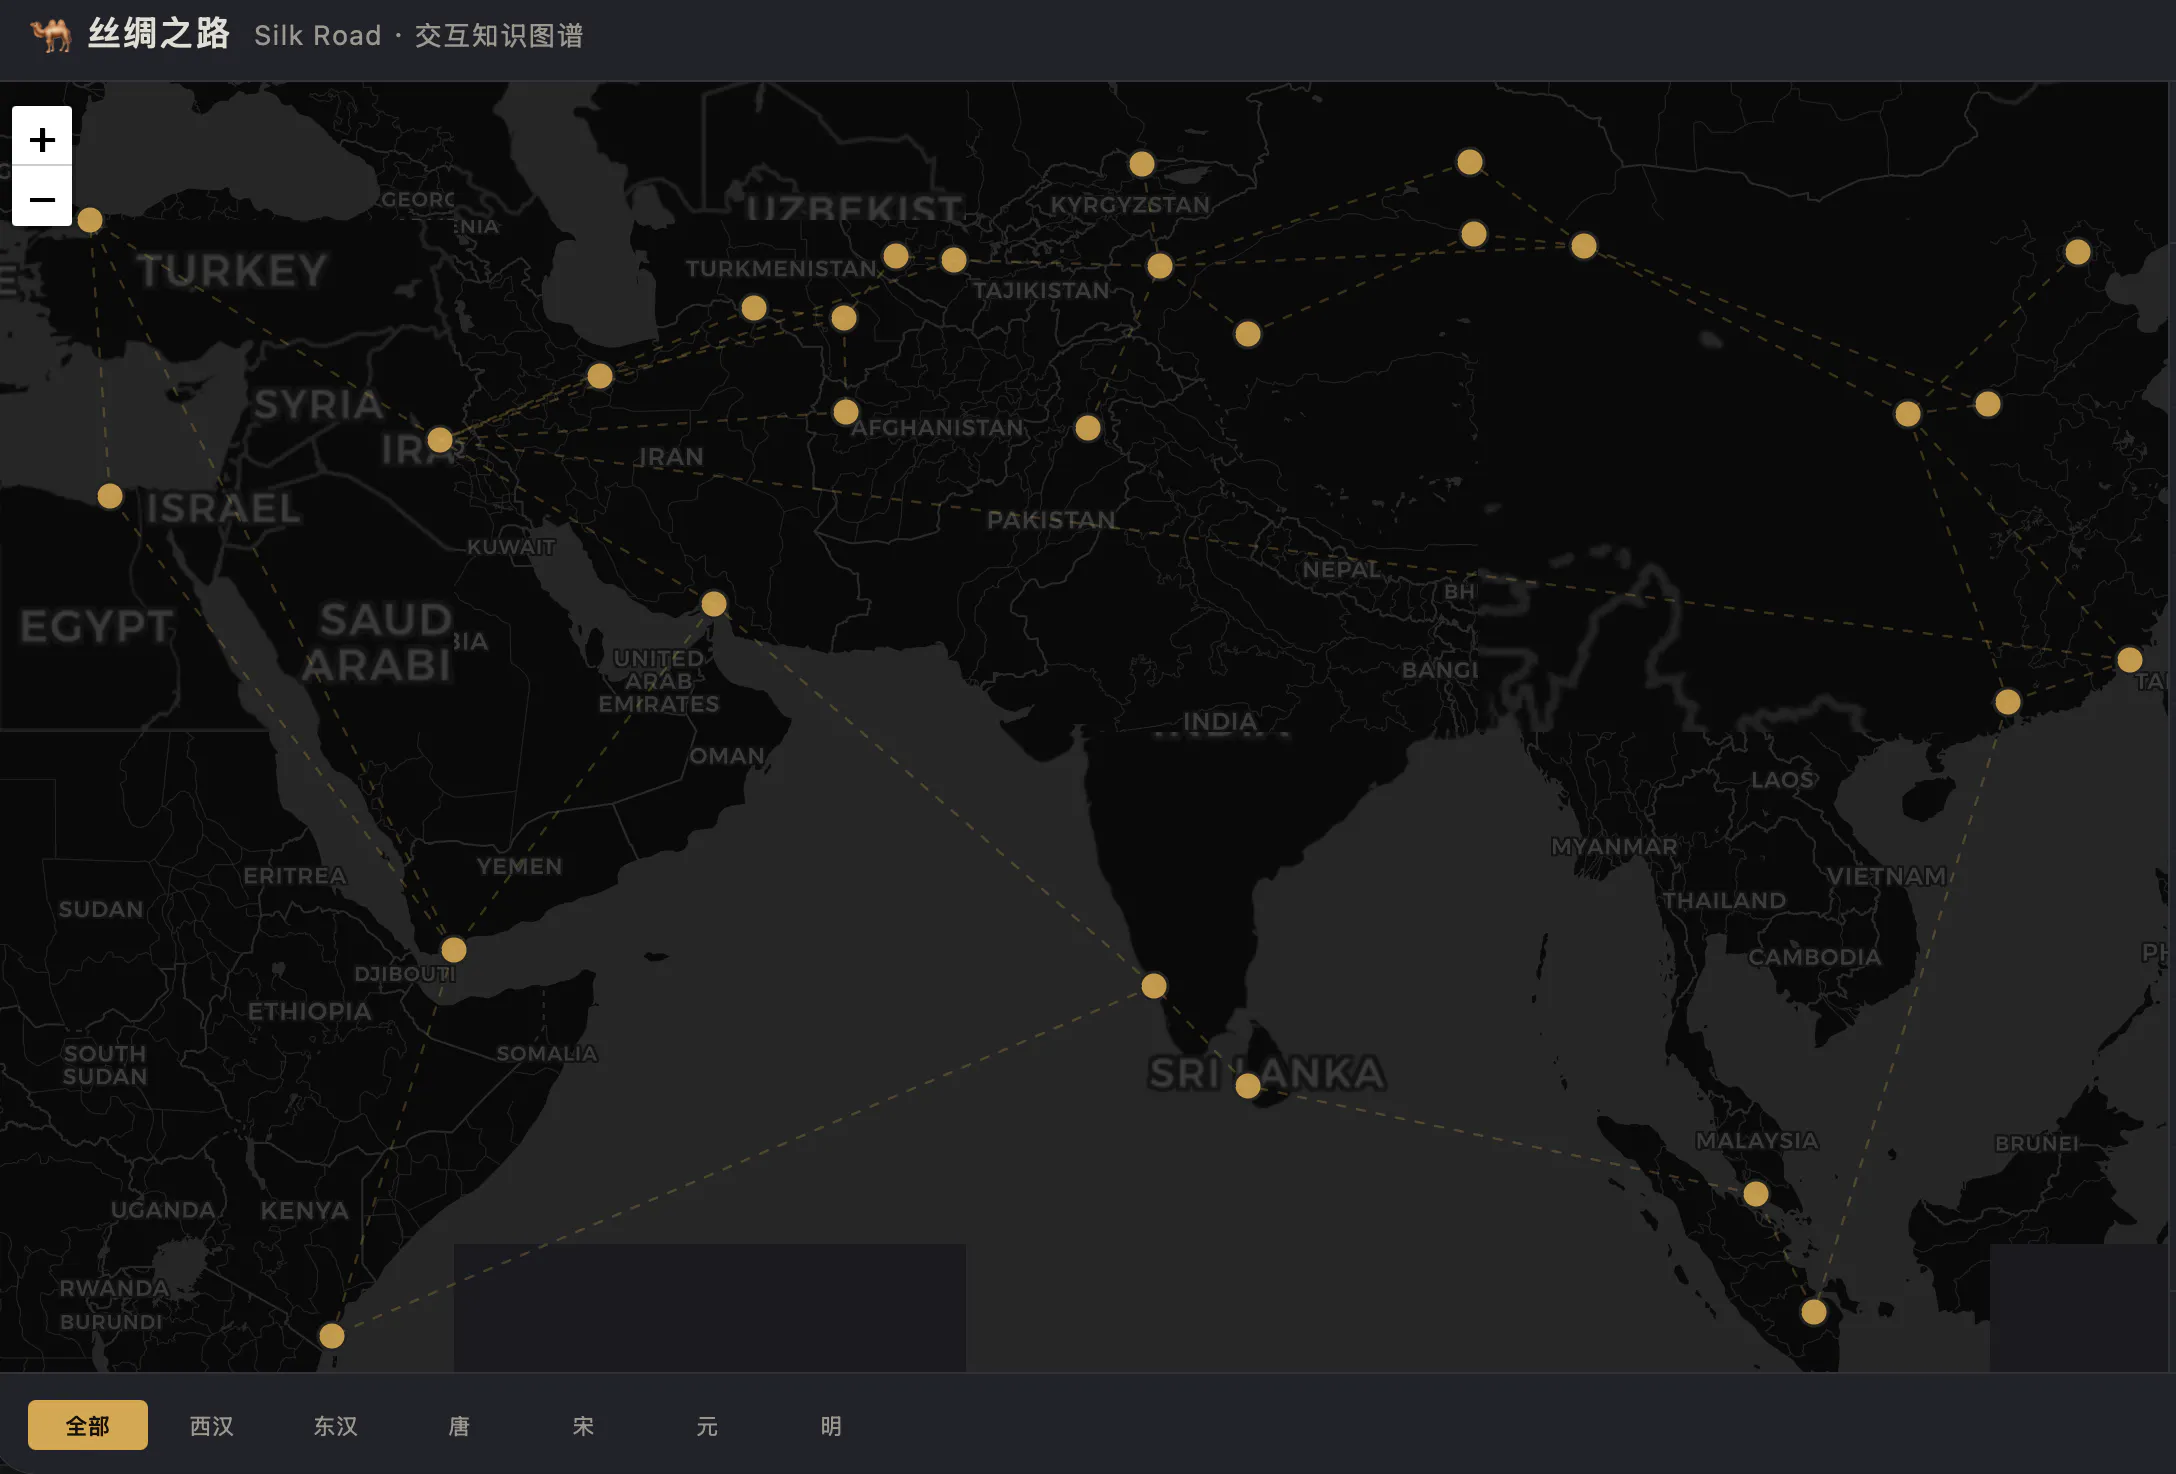
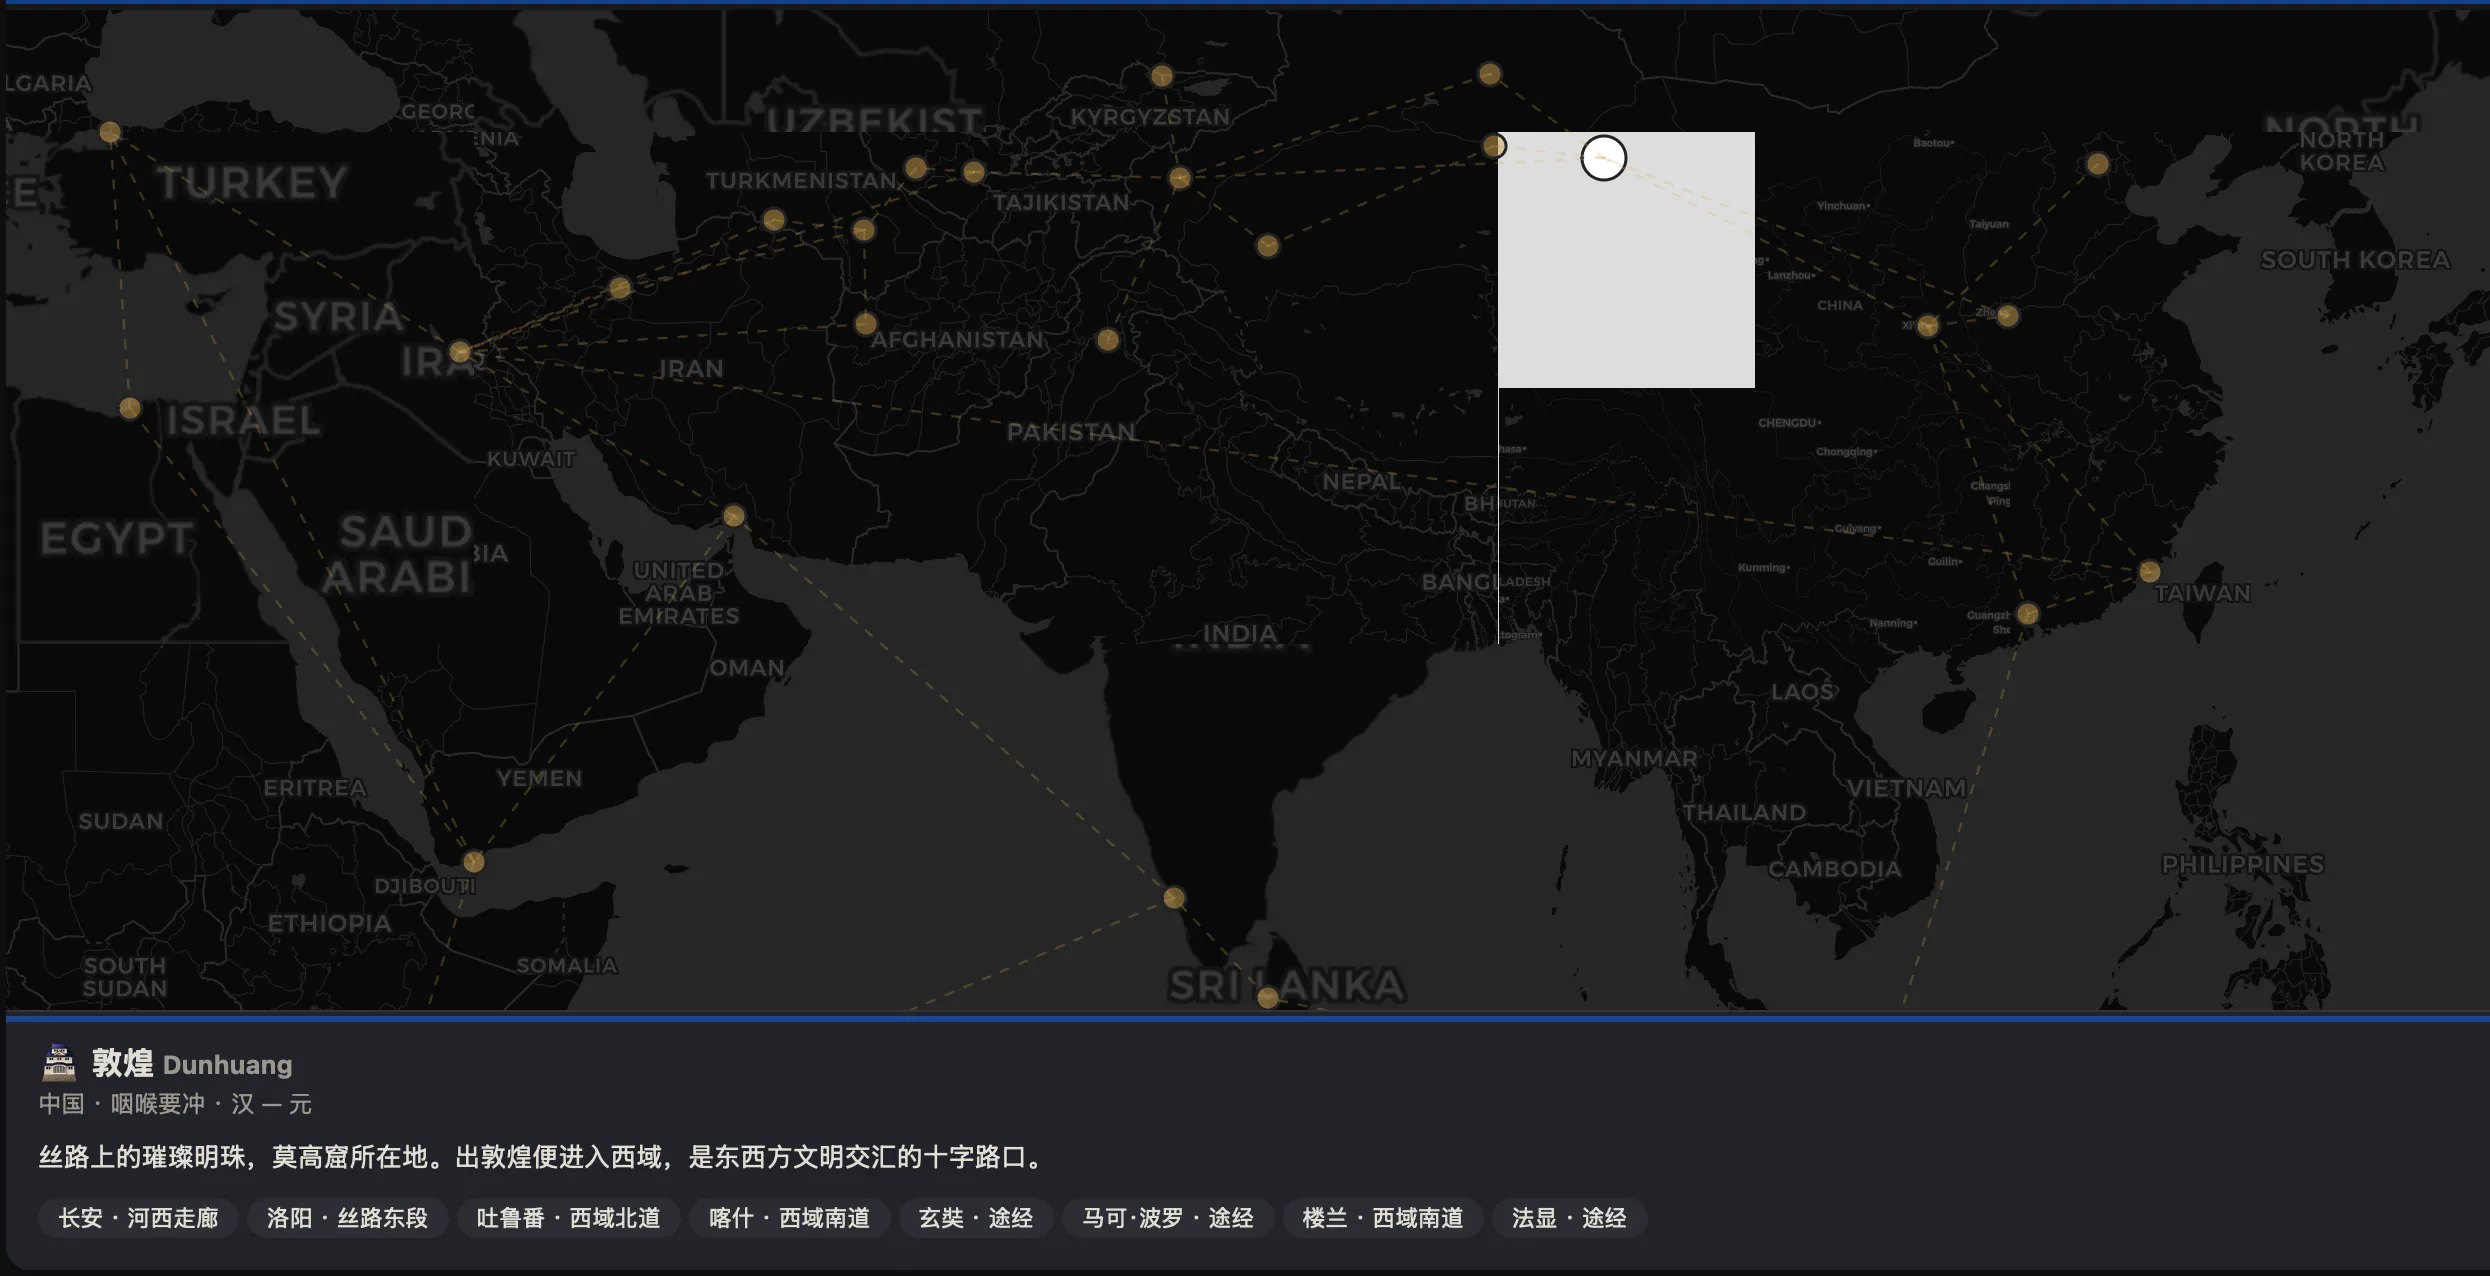
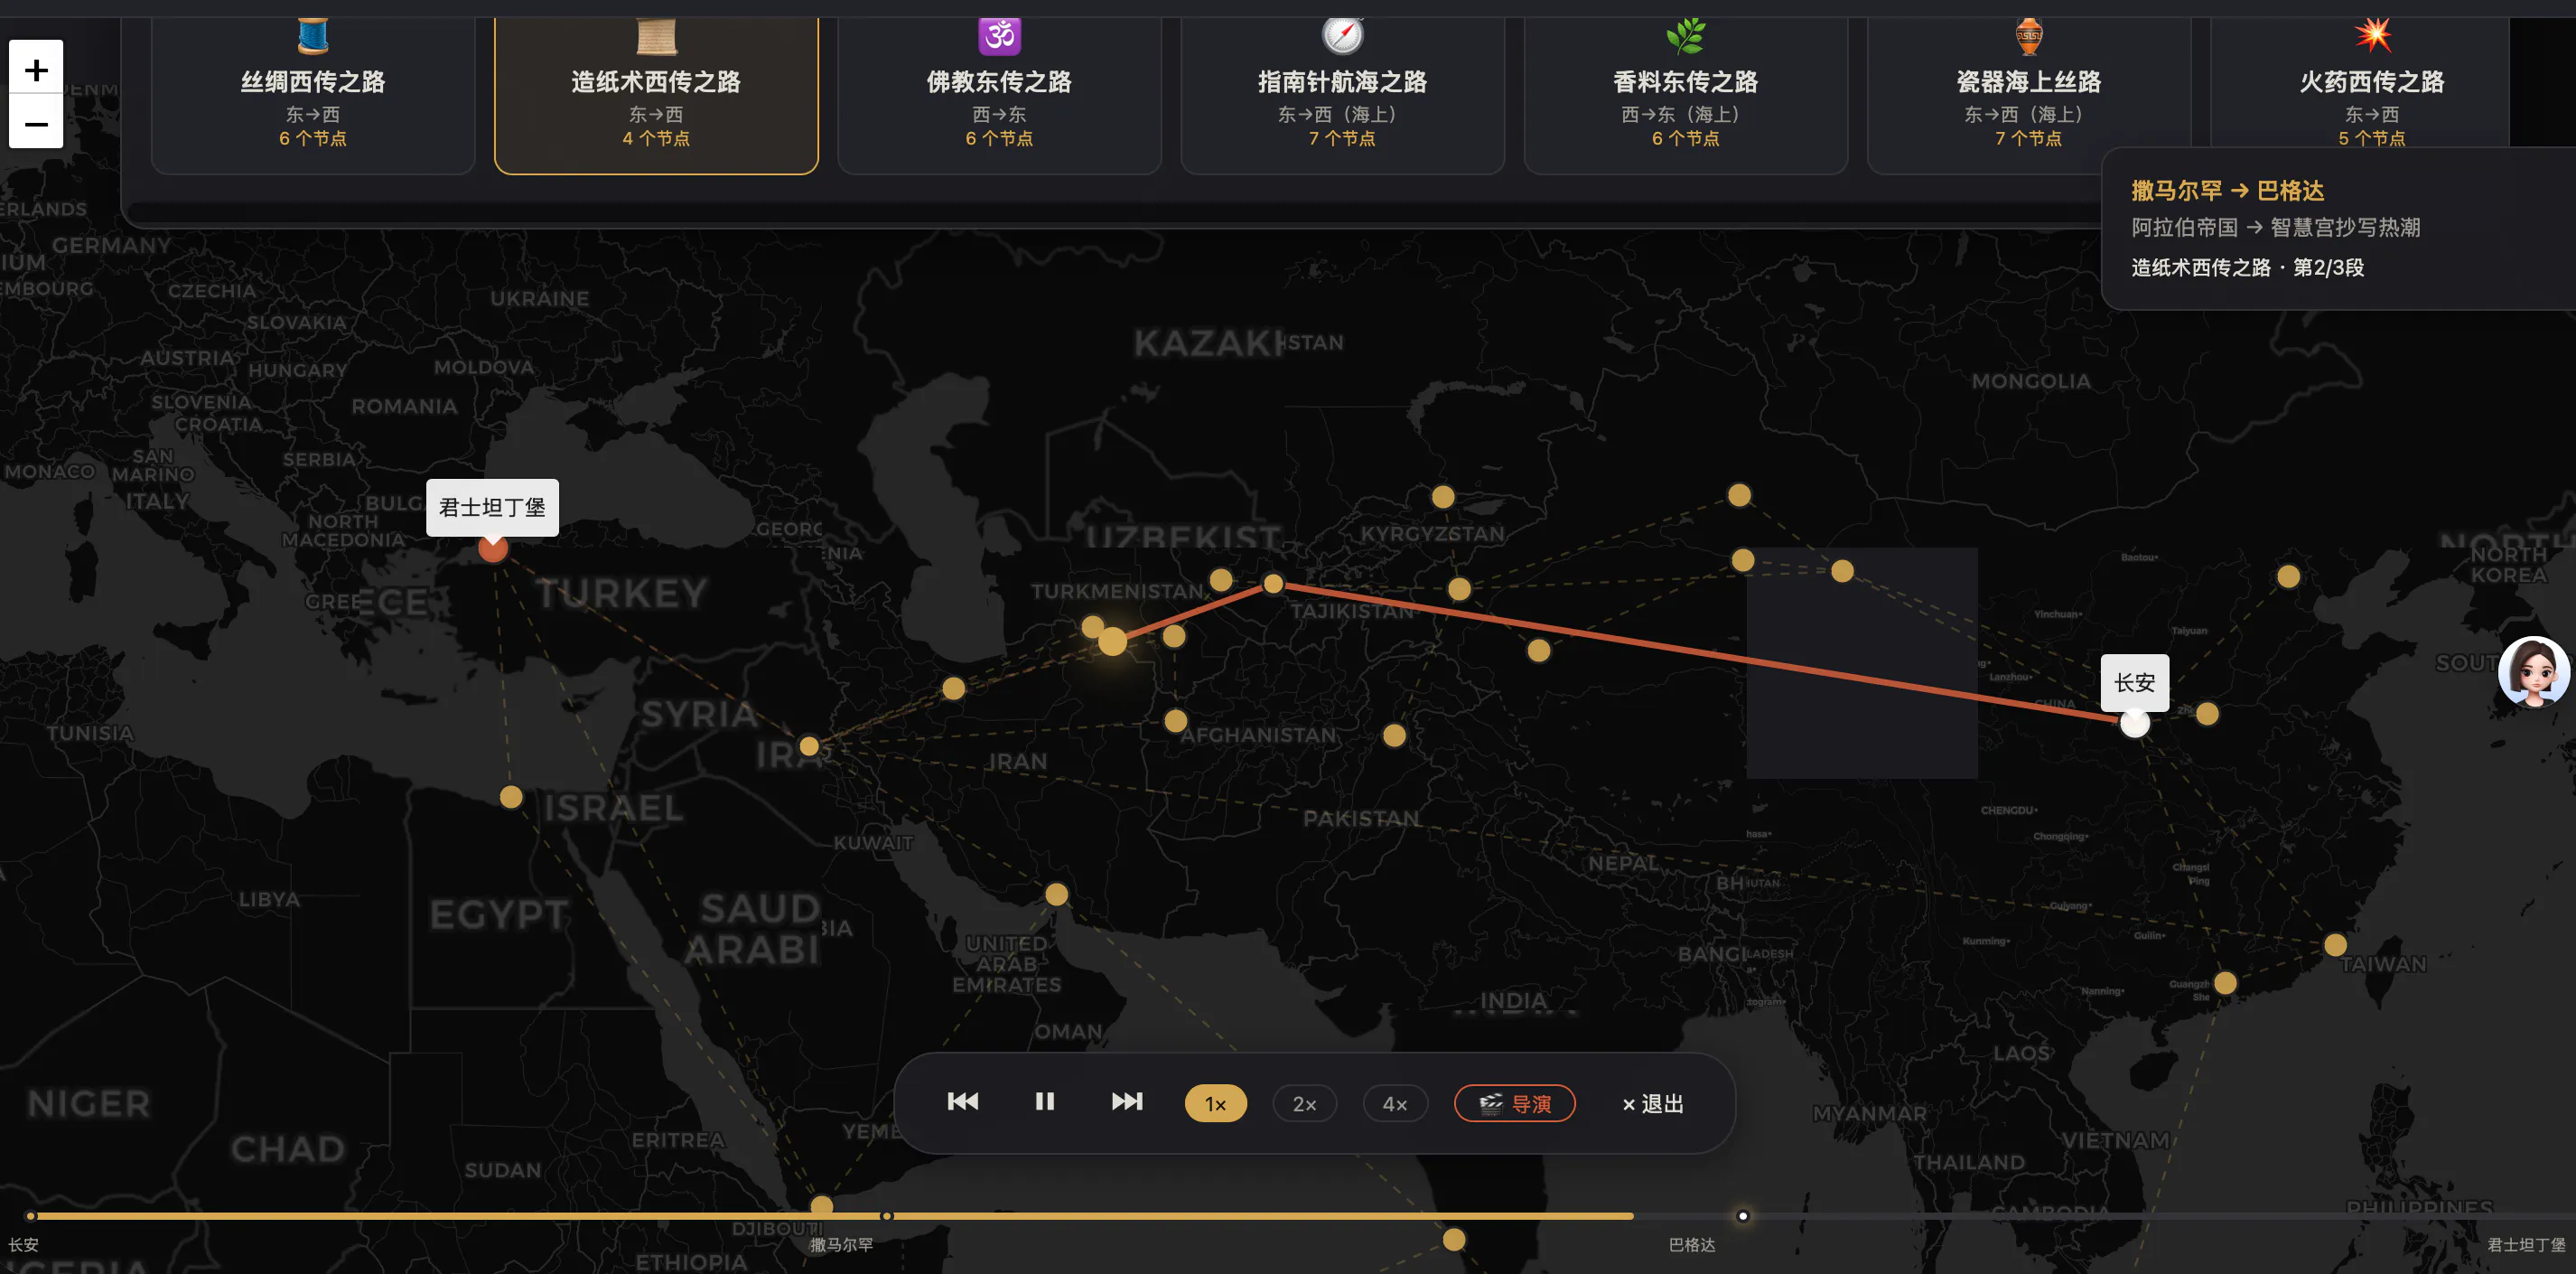
Explore 2,000 years of East-West exchange in one interactive graph. 32 cities on real coordinates, 21 historical figures, 22 trade goods, 16 events — all connected through 211 relationship edges. 8 animated routes show how silk, paper, gunpowder and Buddhism traveled across continents. Built with Leaflet.js + D3.js v7 + Canvas. Dual-language Chinese/English. All data CC BY-SA 4.0, code MIT — fully open-source.
截圖
?
還沒有評論,來搶沙發吧!
X 上關於 丝绸之路 · 交互知识图谱 的真實討論
去 X 發文