


CSV Dashboard이란?
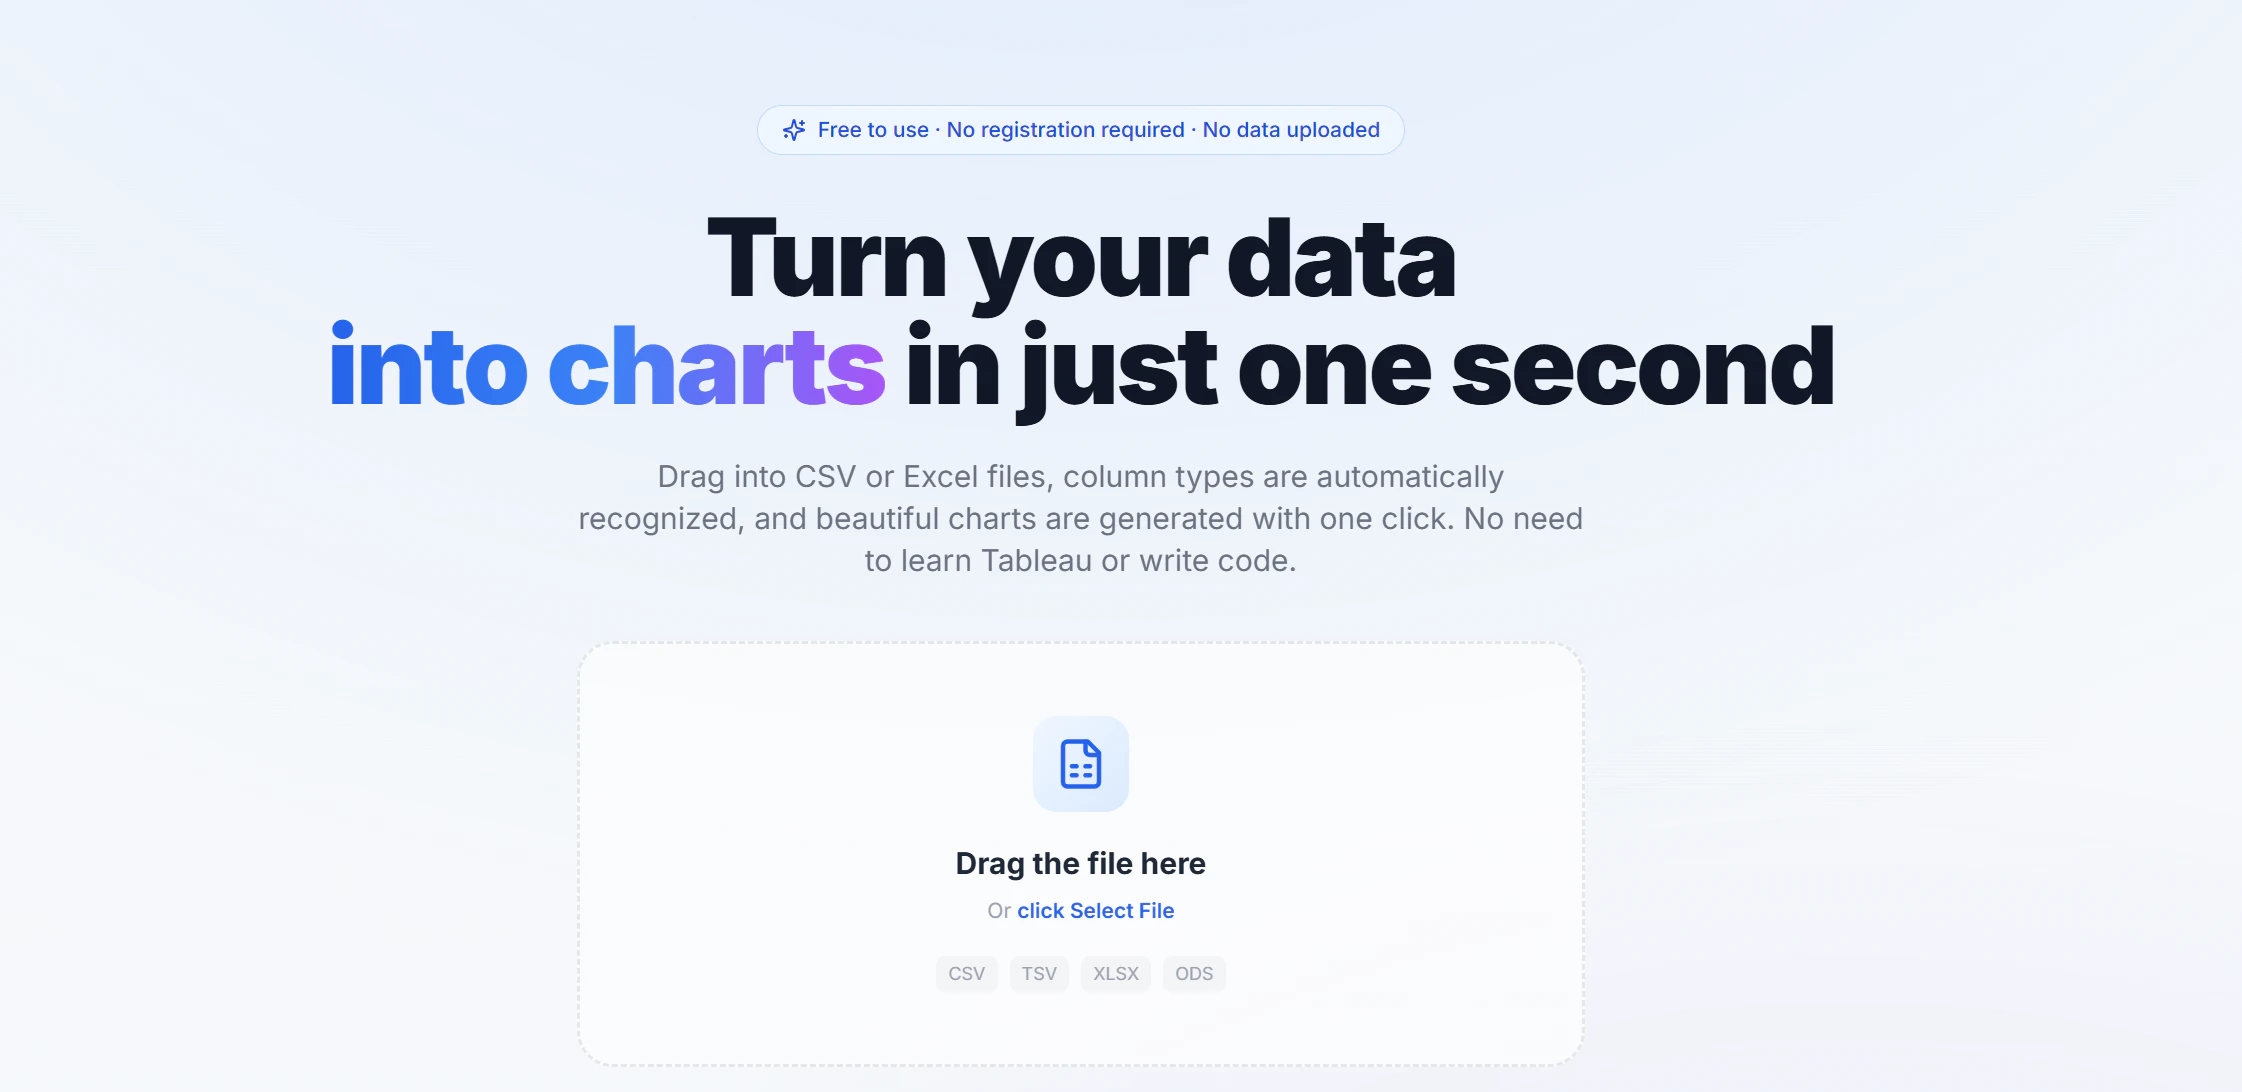
CSV Dashboard — free tool that turns CSV/Excel files into beautiful charts instantly. Drag & drop any file → auto-detect column types → get 6+ chart types (bar, line, pie, scatter, radar, area). Includes correlation matrix, data quality scoring, and one-click data cleaning. 100% browser-based — your data never leaves your computer. No signup required. Free tier available. Pro at $15/month for unlimited charts and high-res export. Try it → csv-dashboard-pro.surge.sh
스크린샷
?
아직 댓글이 없어요. 가장 먼저 남겨보세요!
CSV Dashboard에 대한 X의 실제 대화
X에 게시