

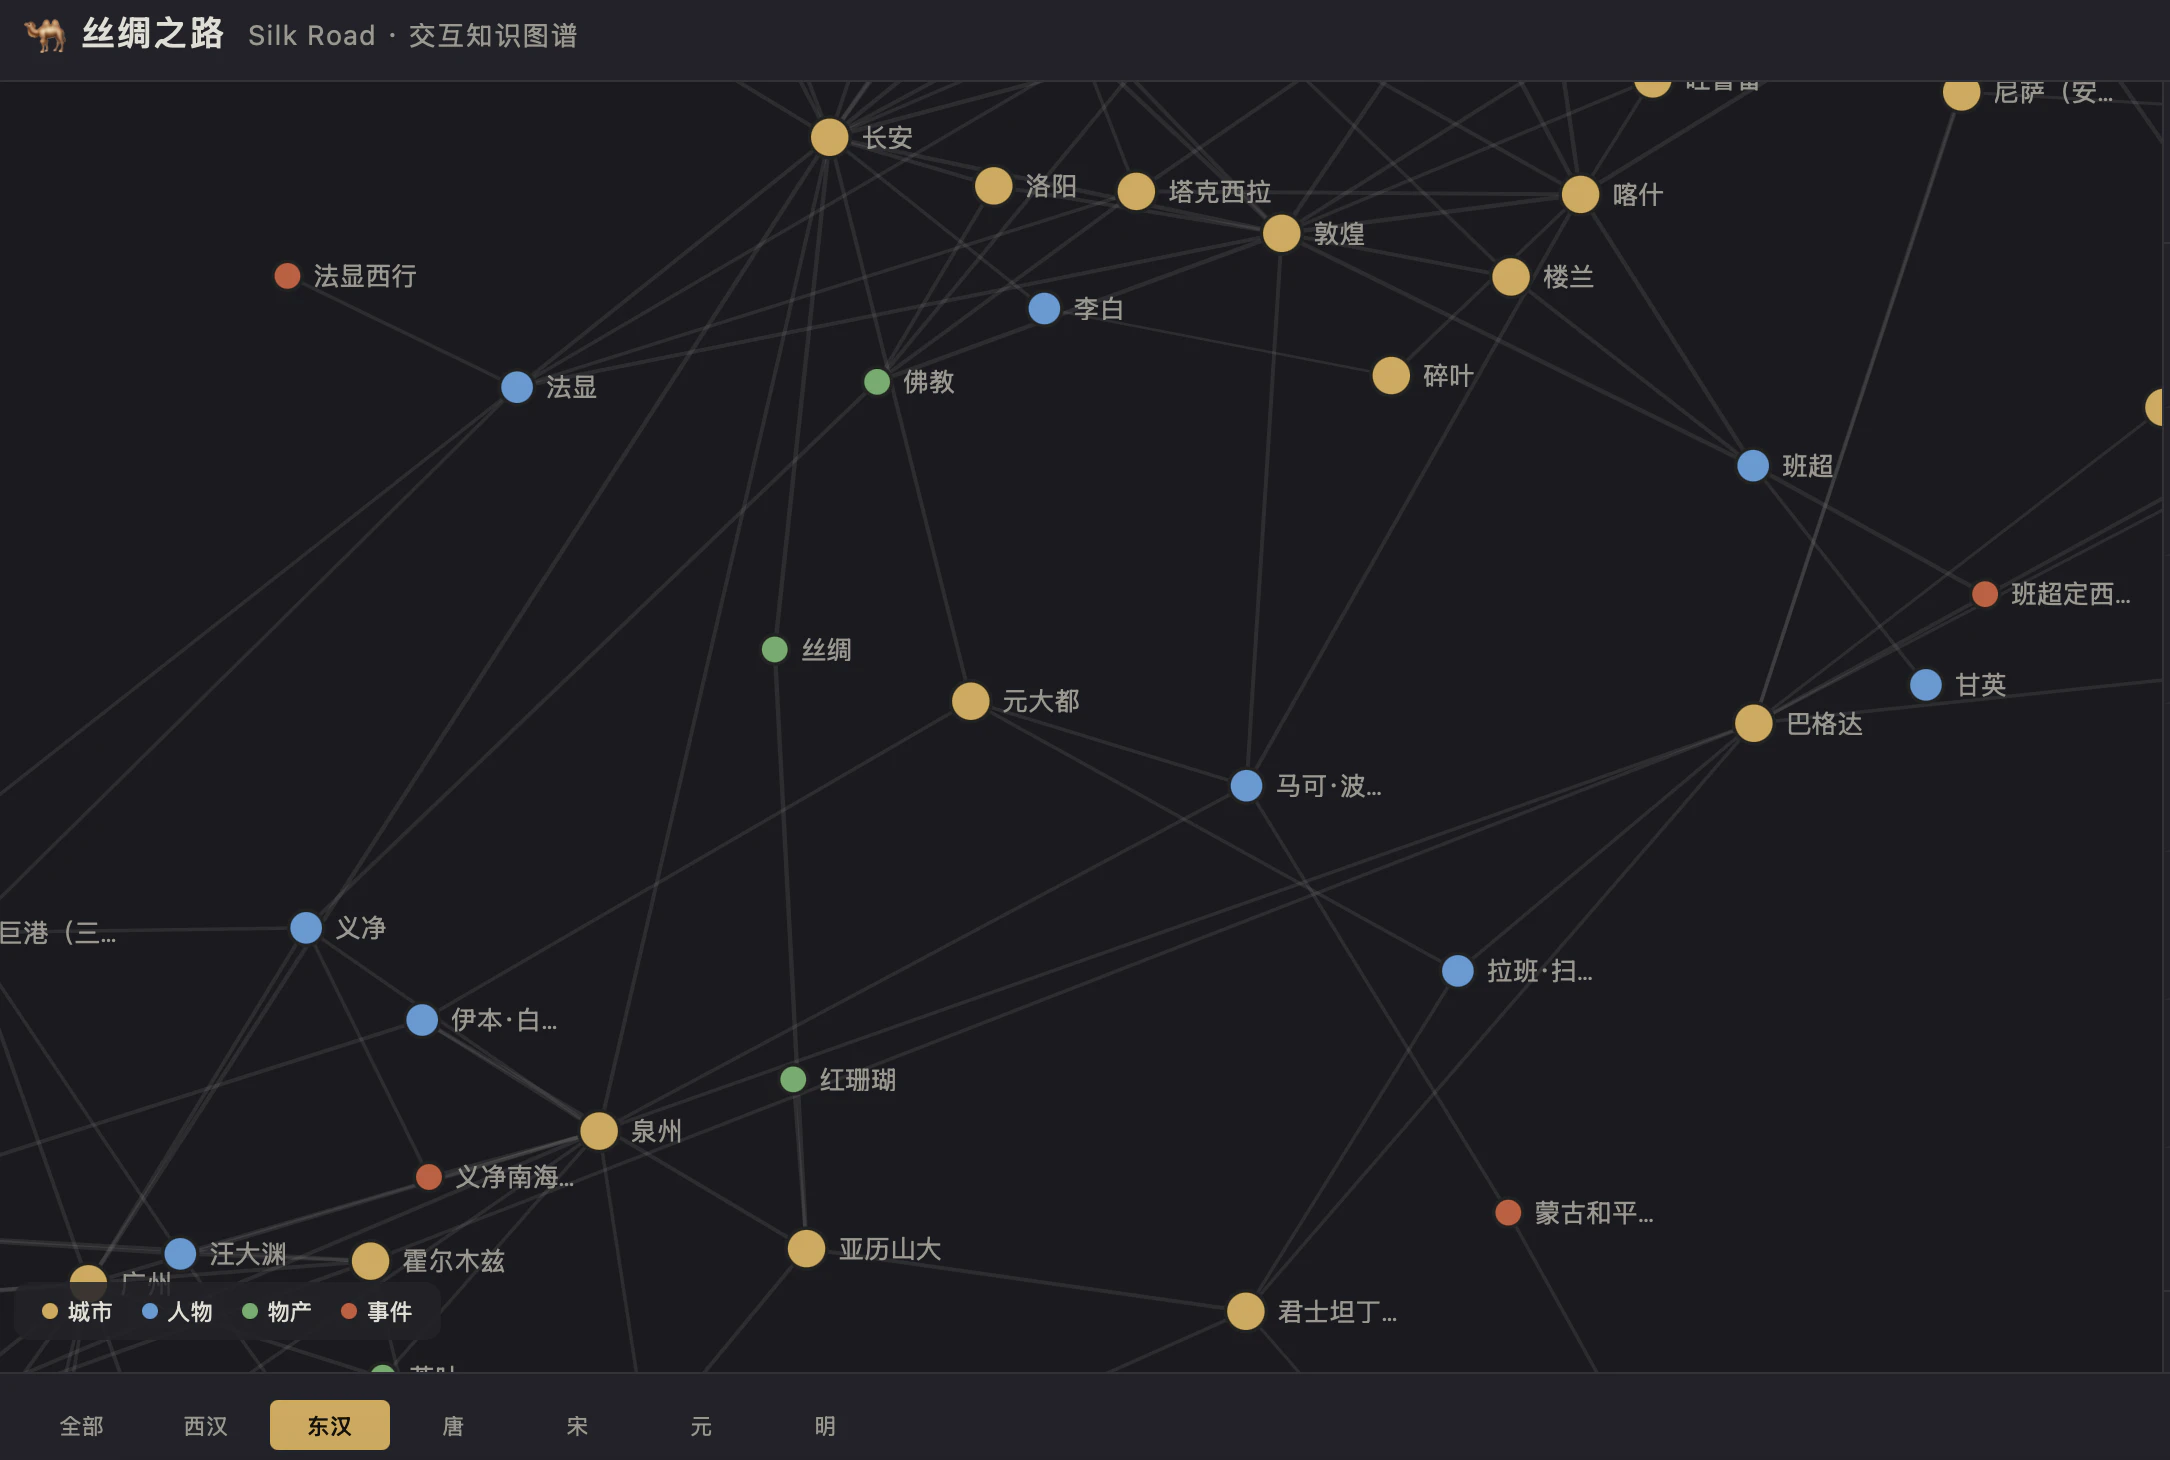
丝绸之路 · 交互知识图谱
Interactive knowledge graph of the ancient Silk Road
丝绸之路 · 交互知识图谱이란?
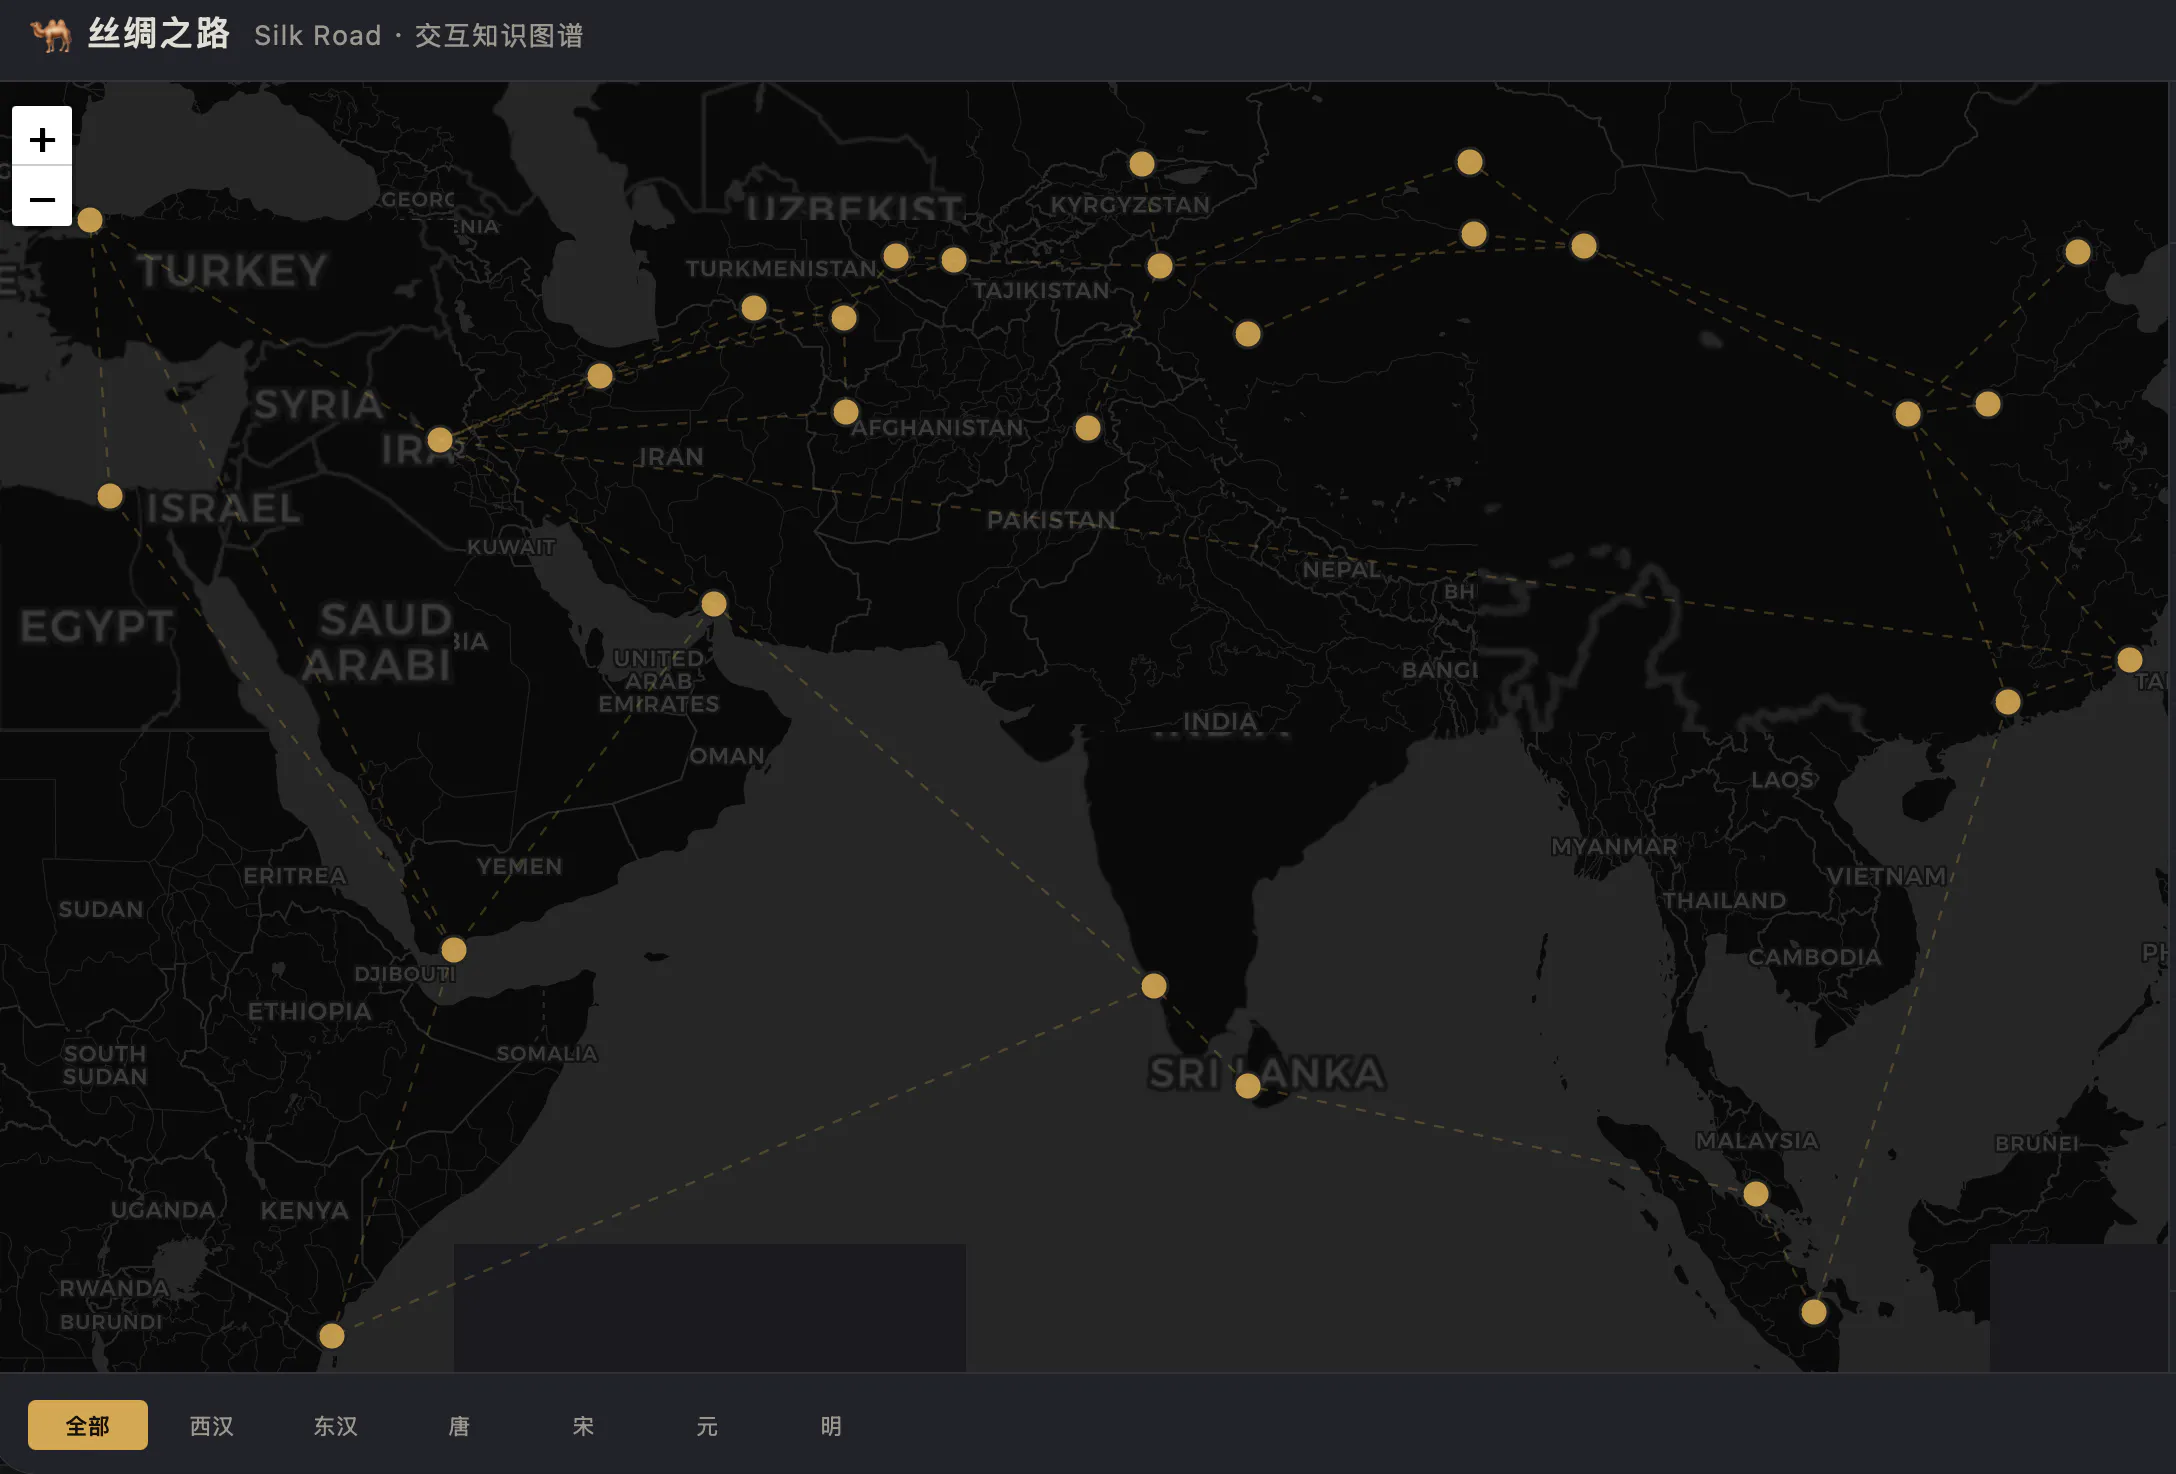
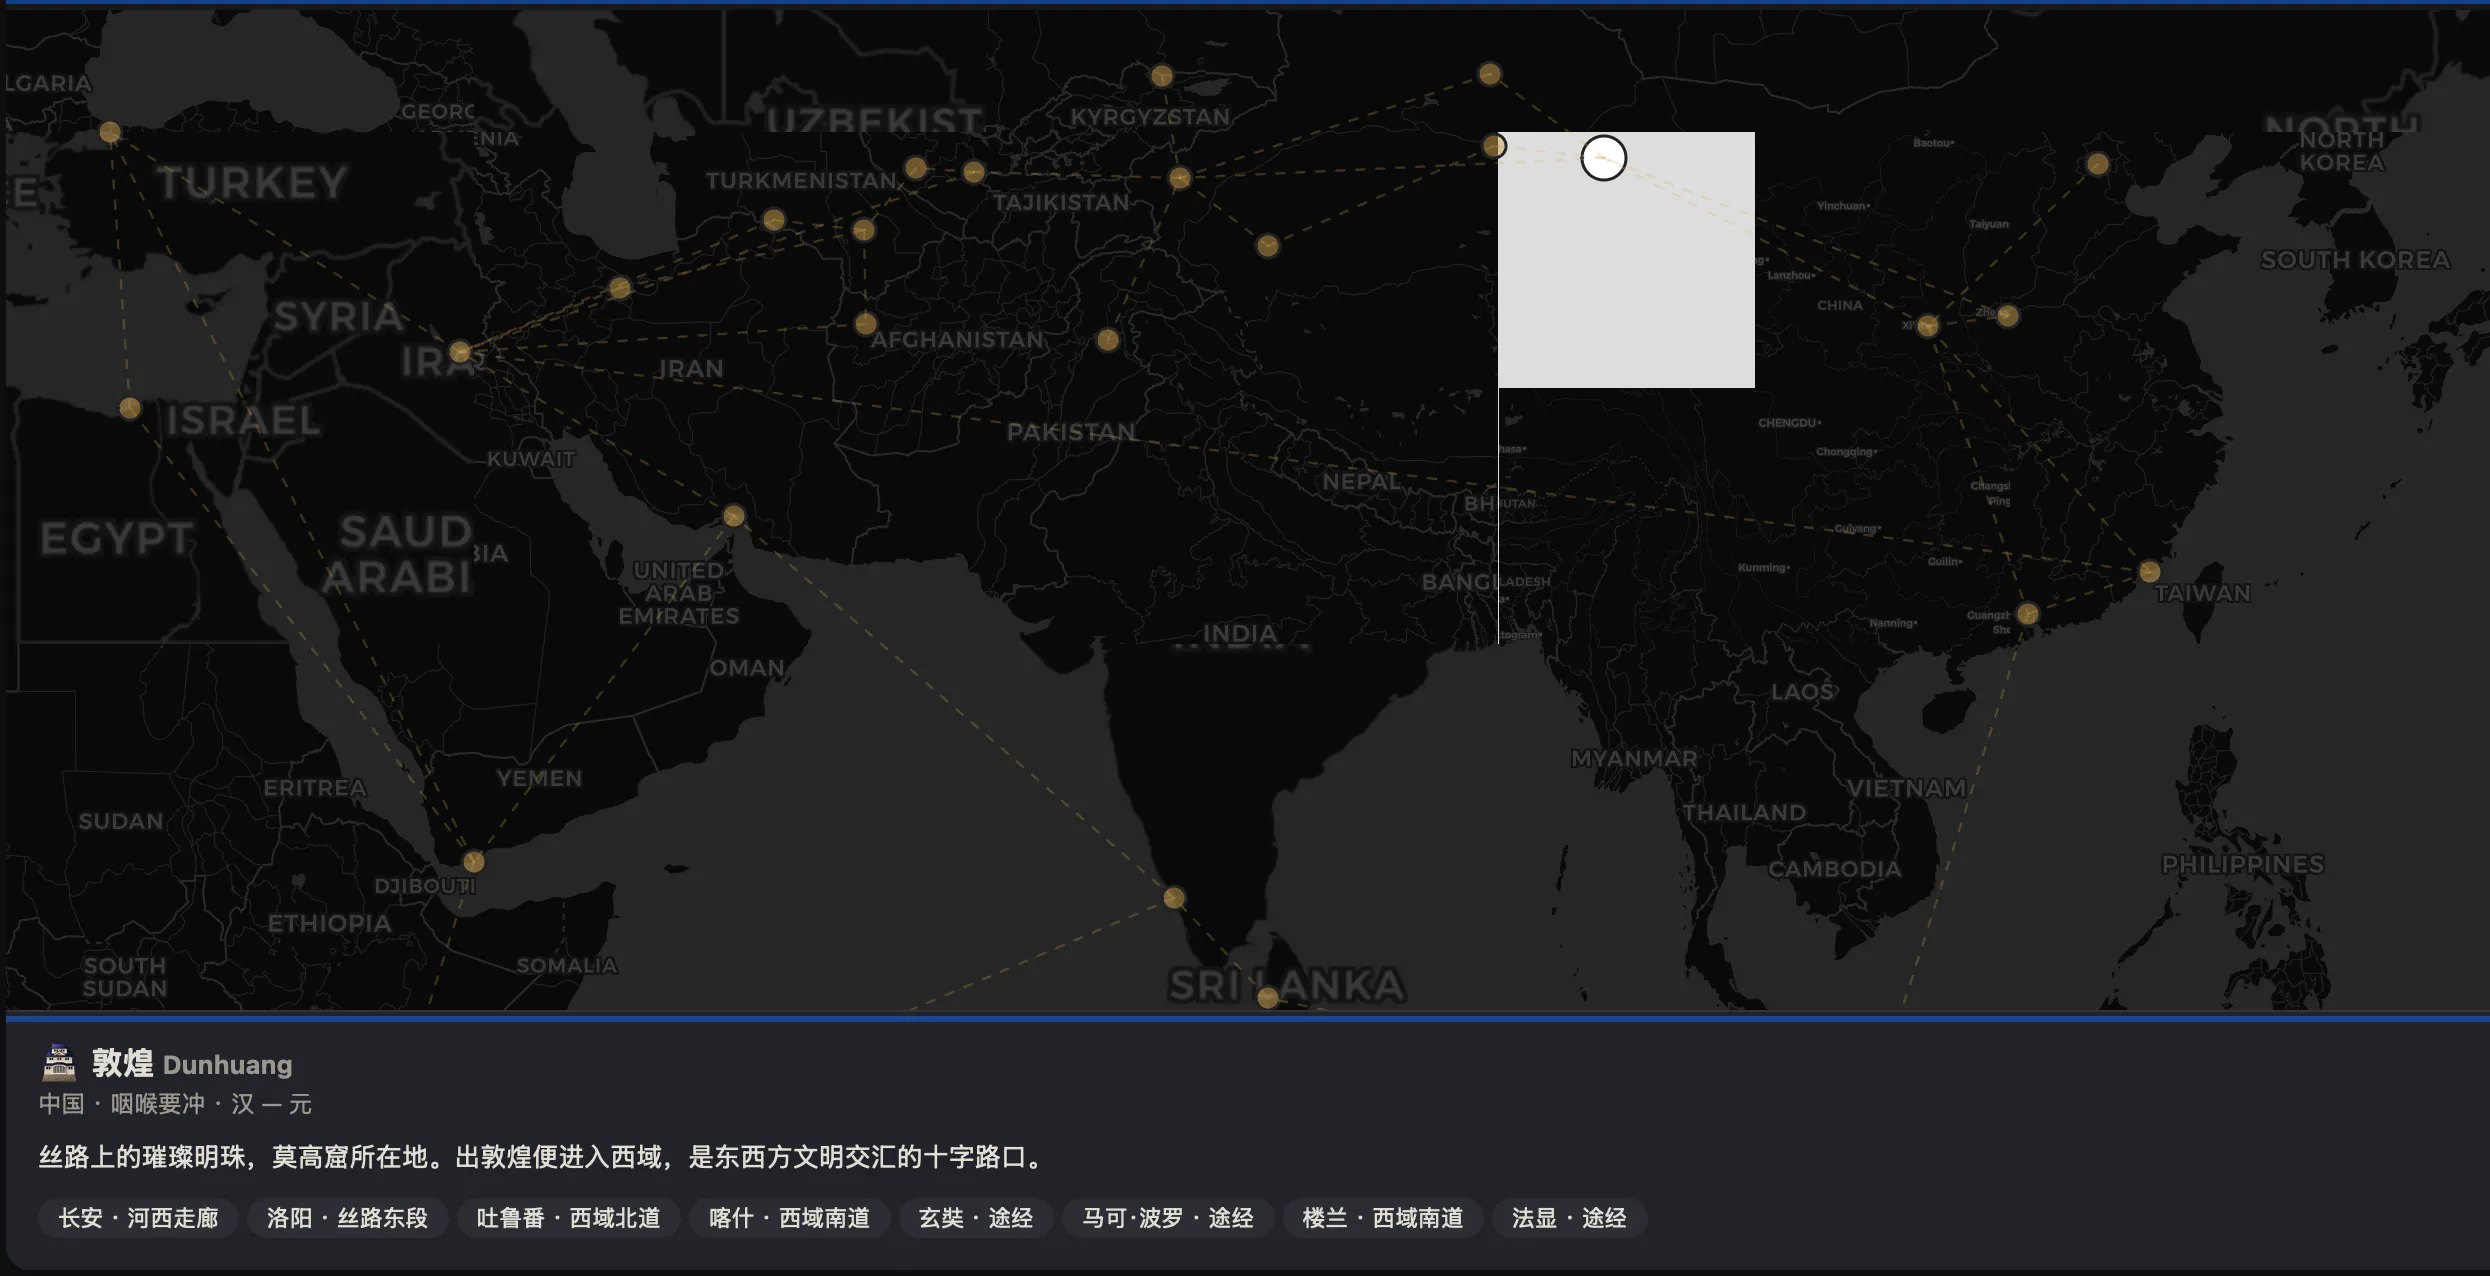
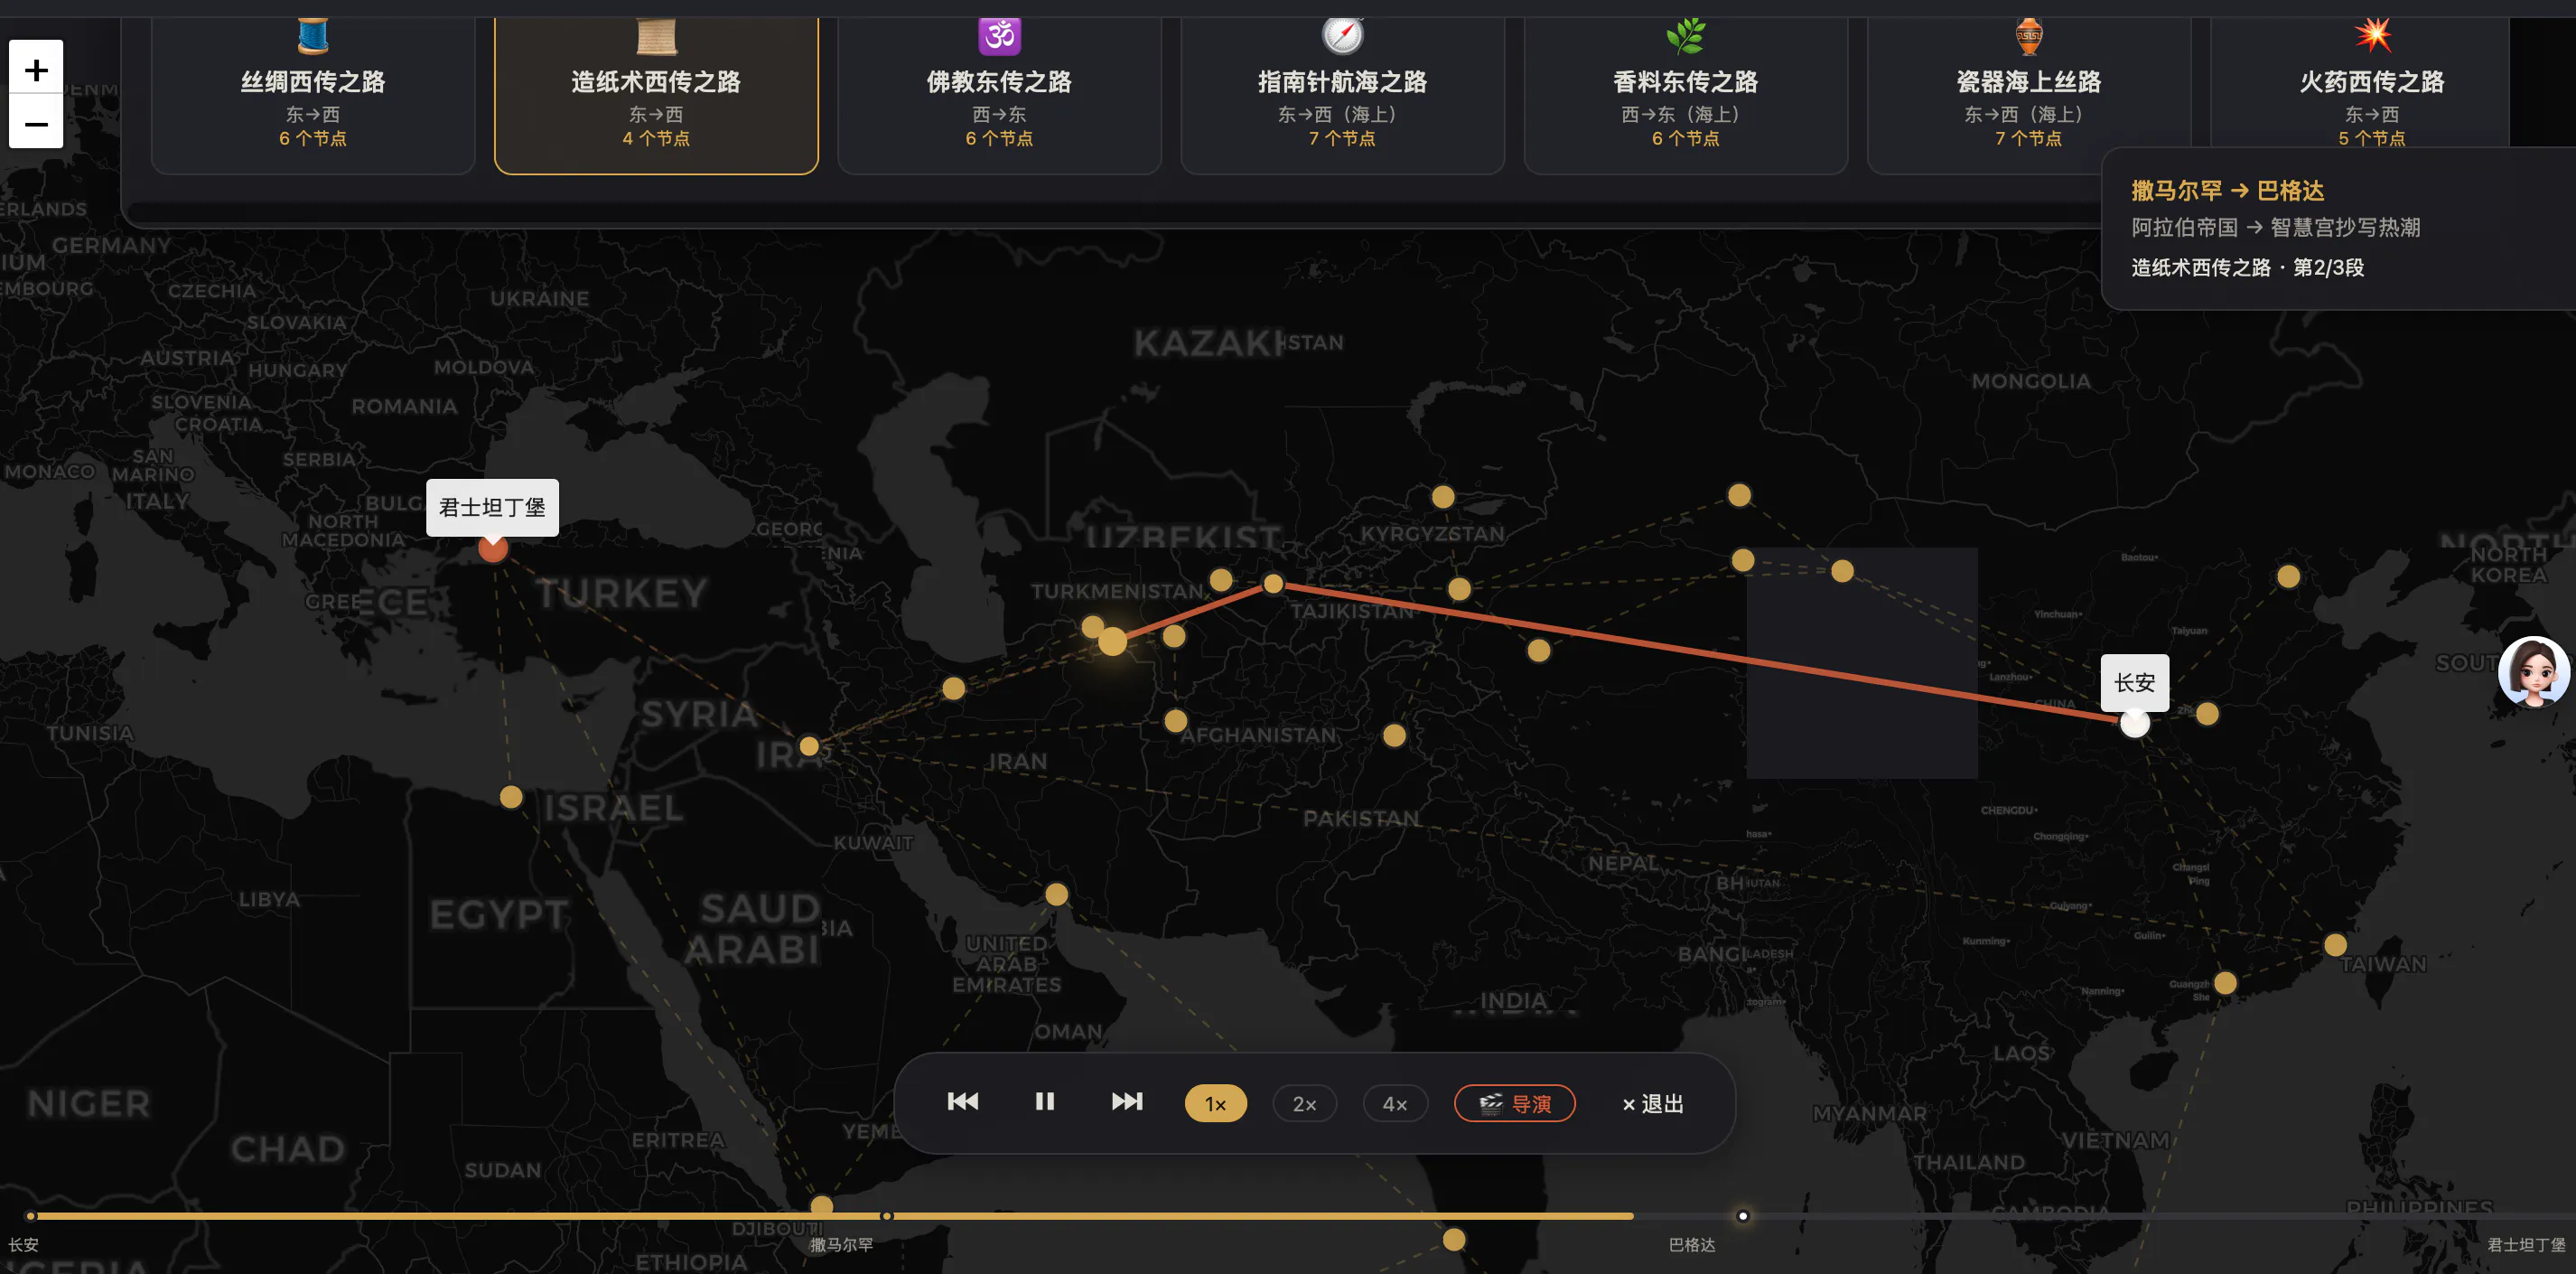
Explore 2,000 years of East-West exchange in one interactive graph. 32 cities on real coordinates, 21 historical figures, 22 trade goods, 16 events — all connected through 211 relationship edges. 8 animated routes show how silk, paper, gunpowder and Buddhism traveled across continents. Built with Leaflet.js + D3.js v7 + Canvas. Dual-language Chinese/English. All data CC BY-SA 4.0, code MIT — fully open-source.
스크린샷
?
아직 댓글이 없어요. 가장 먼저 남겨보세요!
丝绸之路 · 交互知识图谱에 대한 X의 실제 대화
X에 게시