


Graphoria — Git as a Graph
See your entire Git history as an interactive graph.
¿Qué es Graphoria — Git as a Graph?
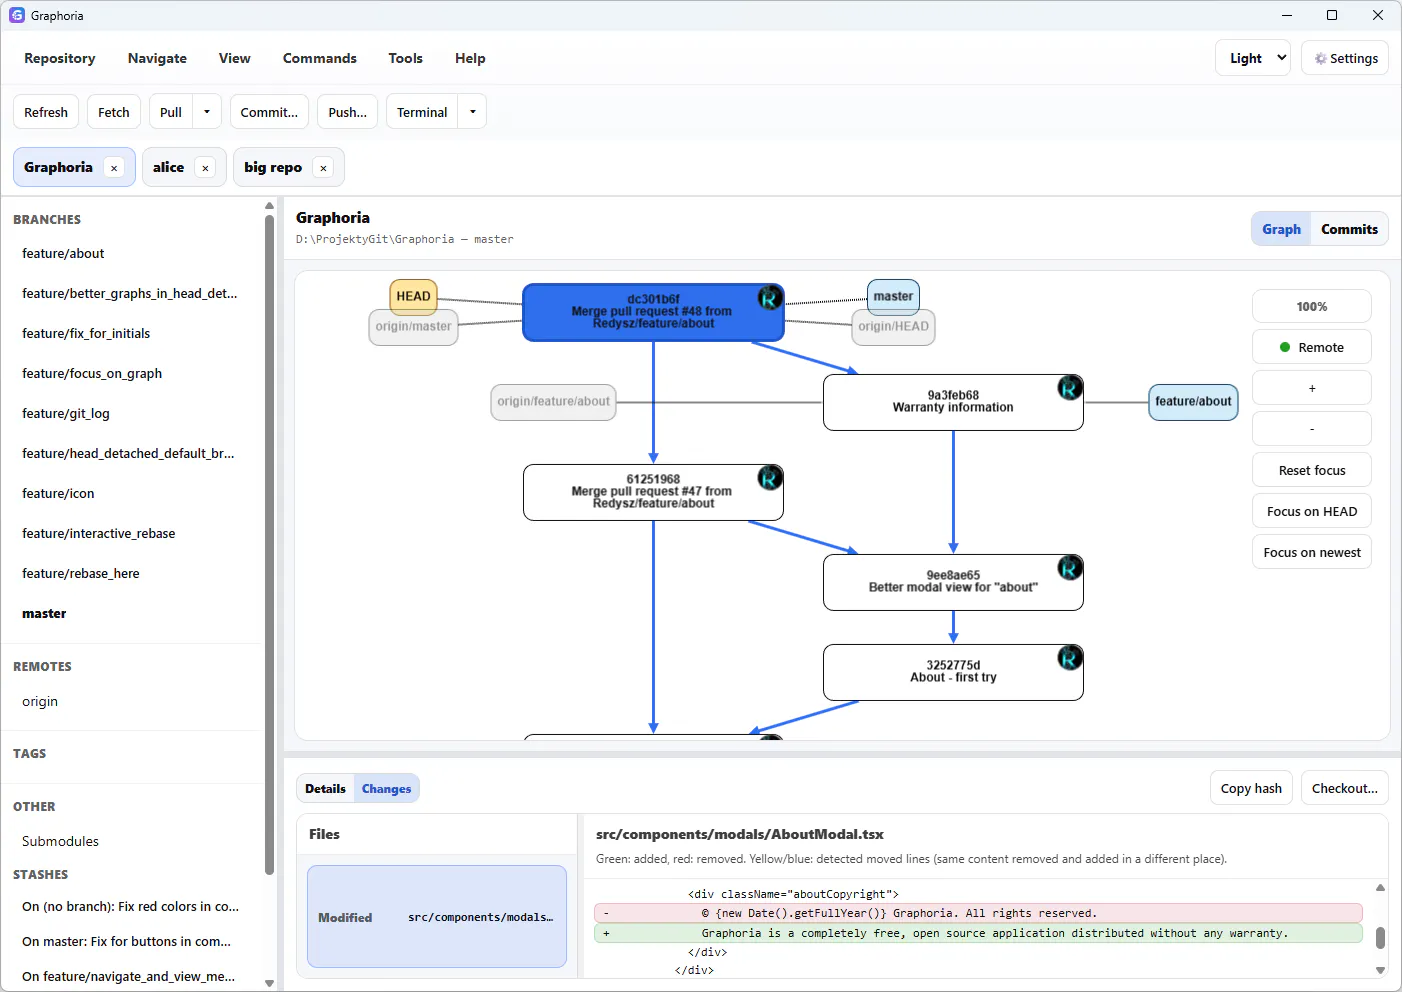
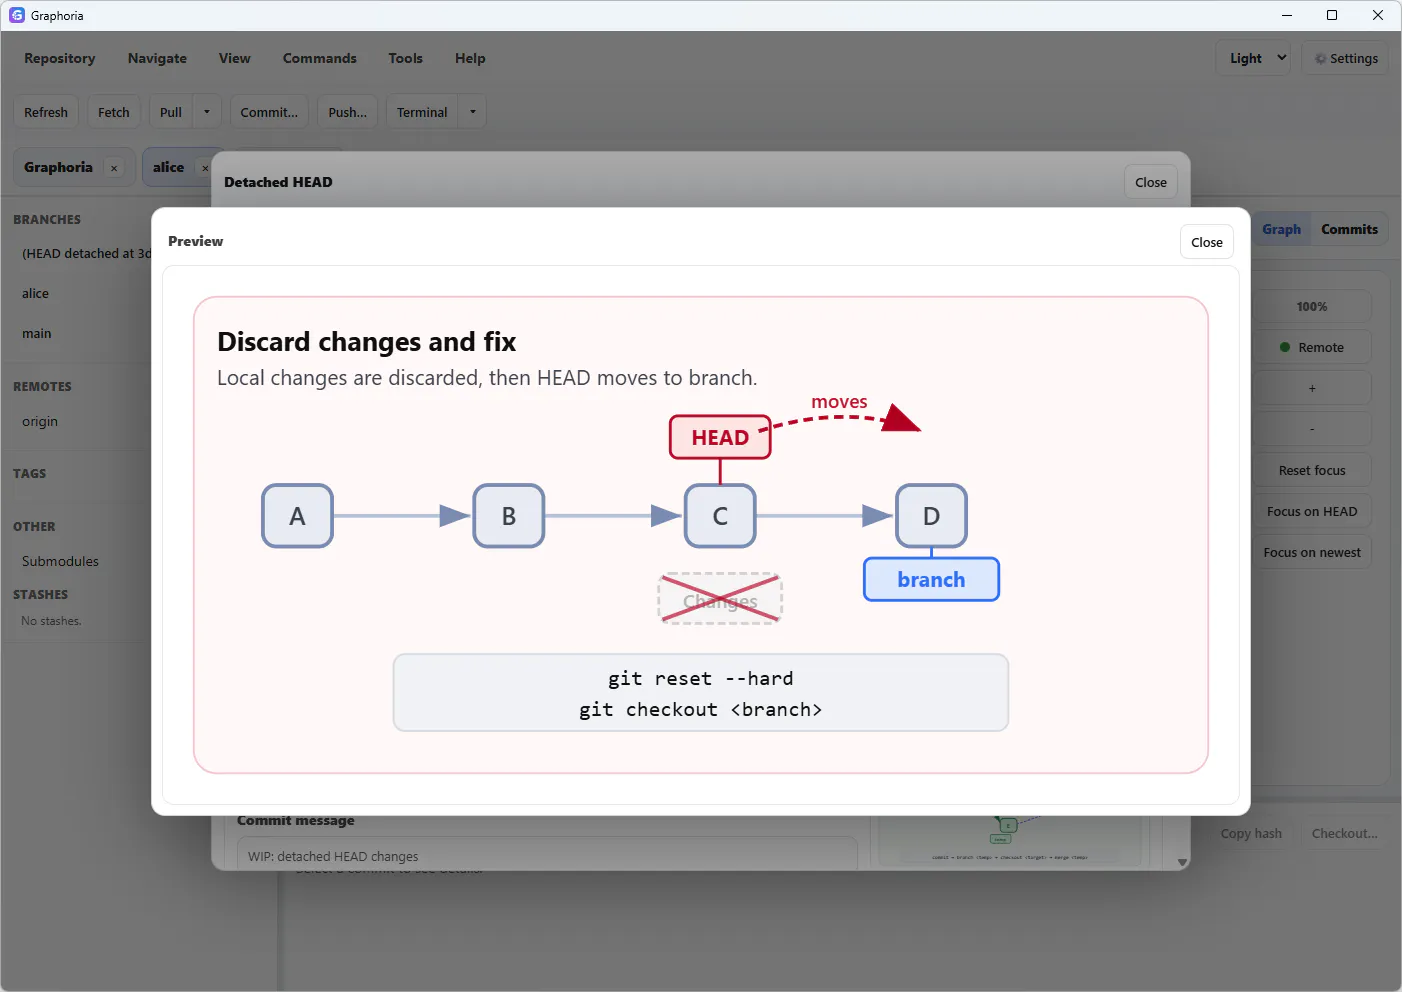
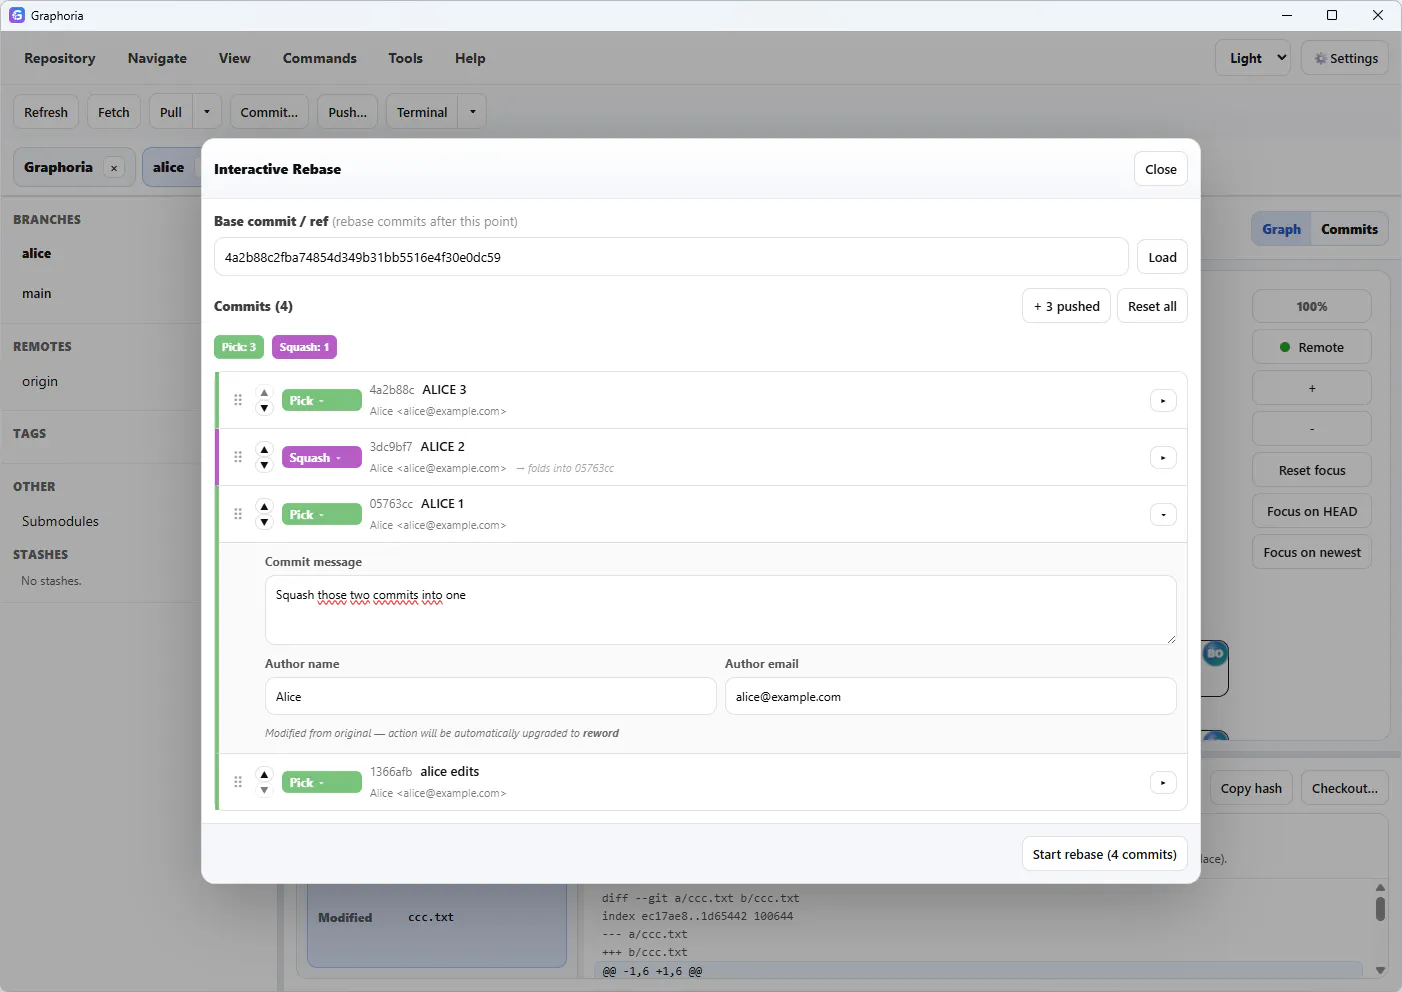
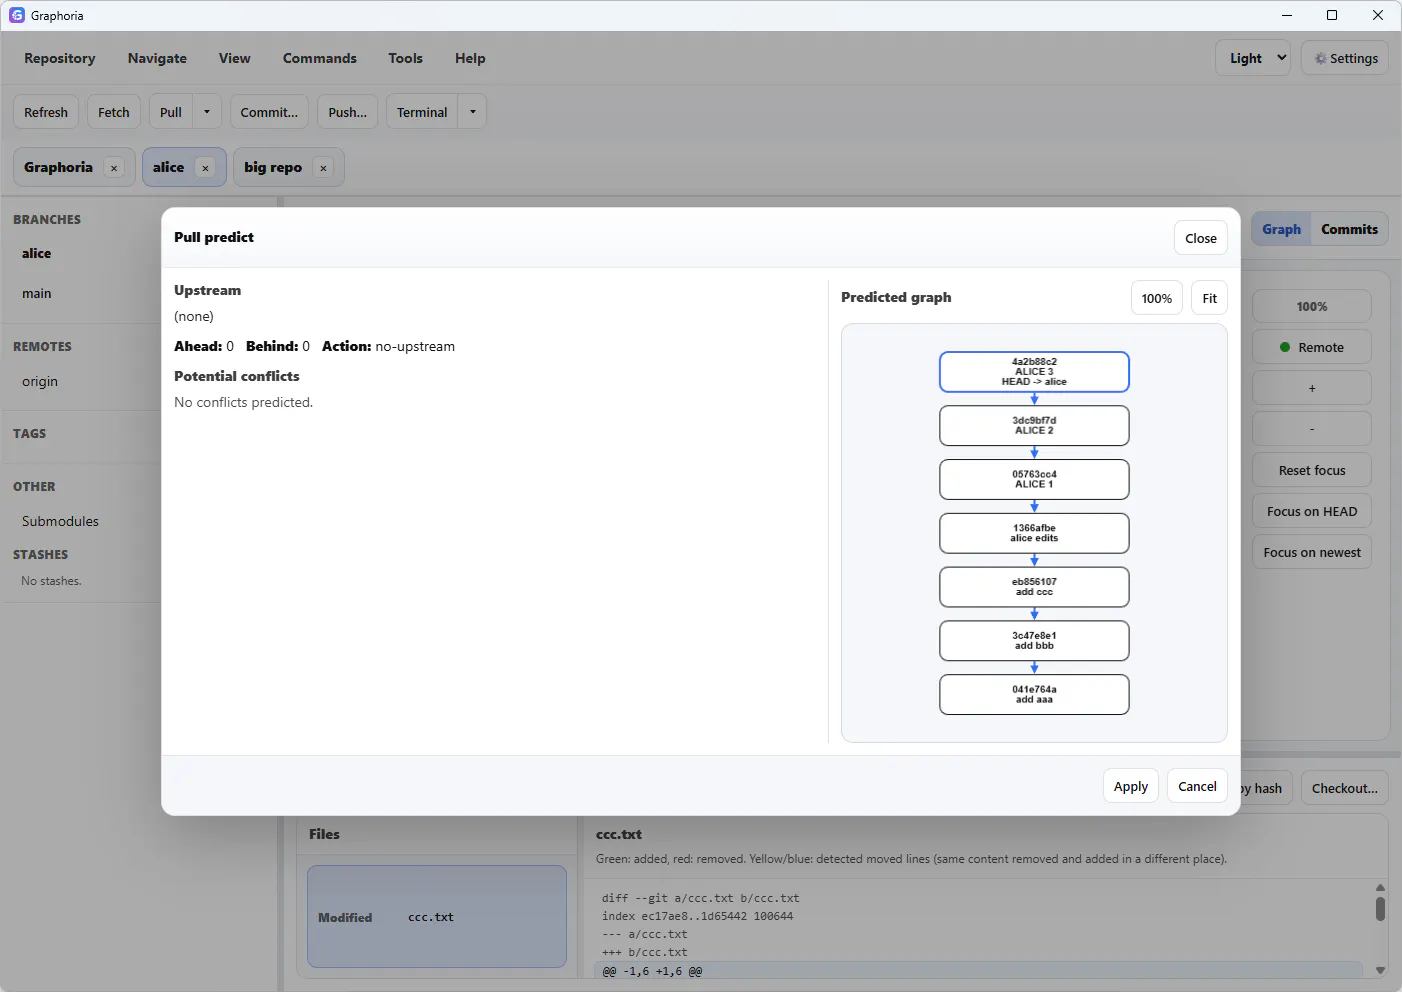
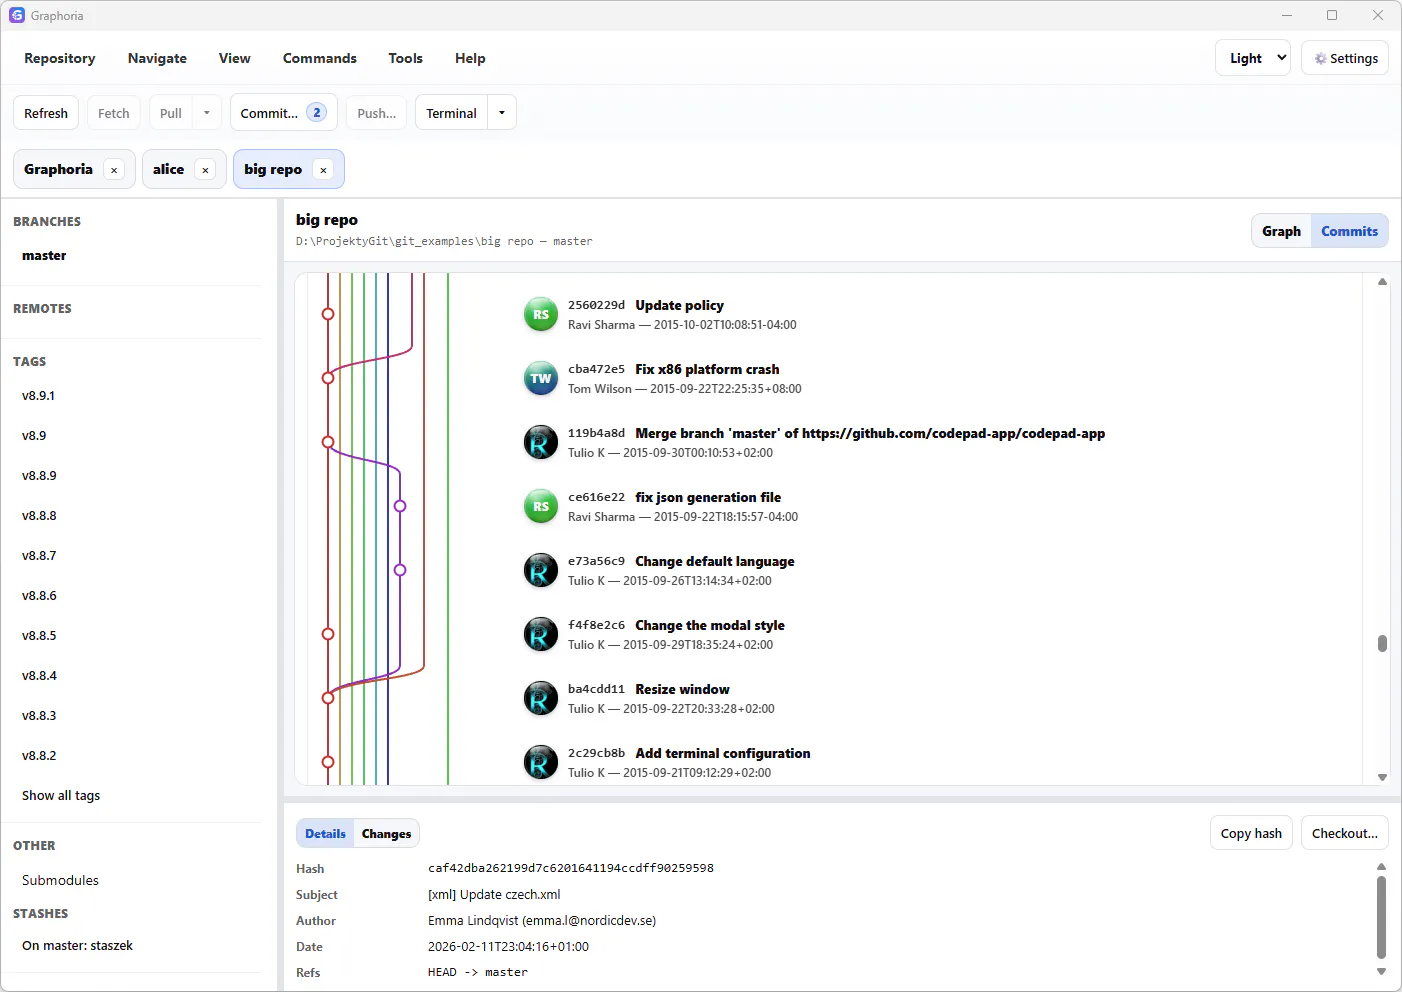
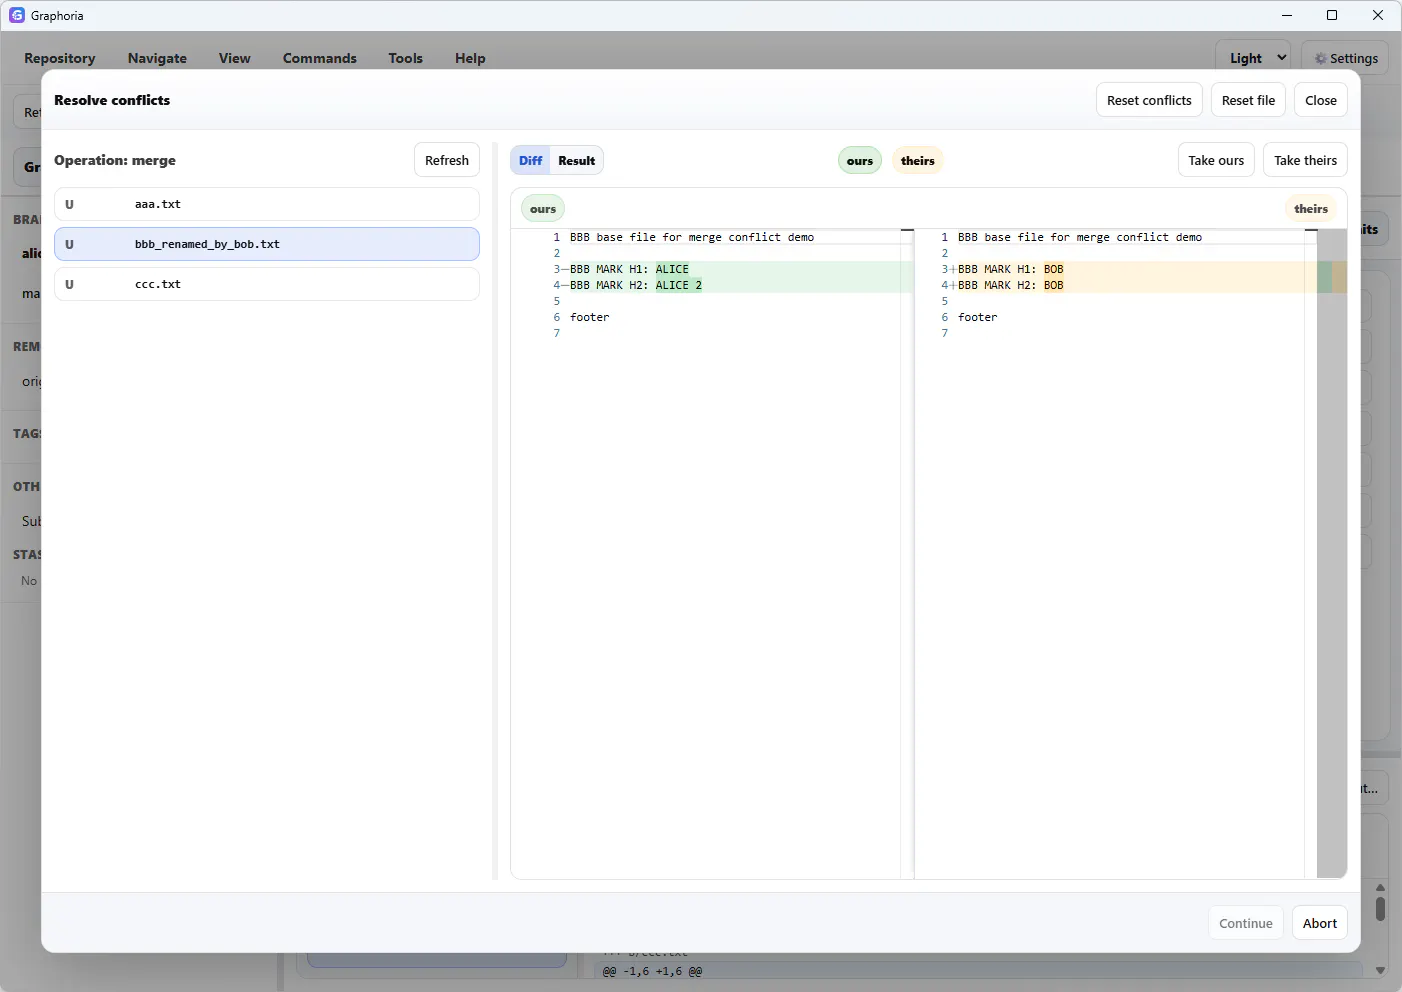
Graphoria is a free, open-source Git GUI that replaces boring commit tables with a beautiful, interactive directed acyclic graph (DAG). Pan, zoom, and explore your entire repository history visually. What makes it different: → Graph Prediction — preview how merge, rebase, or reset will change your graph before you execute it. → Interactive DAG — drag, zoom, and navigate commits as nodes in a real graph, → Visual conflict resolution → 4 themes (light, dark, blue, sepia), fully customizable UI
Demo
Capturas de pantalla
?
Aún no hay comentarios. ¡Sé el primero!
Conversaciones reales sobre Graphoria — Git as a Graph en X
Publicar en X